Examples of calculations with ZG.x
Author: Marios Zacharias
Note
It is perfectly reasonable to obtain ZG displacements that differ from those reported in this tutorial. This difference arises from the gauge freedom of the vibrational modes: modes obtained by diagonalizing the dynamical matrix can differ by a phase factor (or a unitary matrix in case of degeneracy) if calculated on different systems. The final results are not affected by these differences.
Running ZG.x for evaluating temperature-dependent properties with Quantum Espresso
The tutorial is based on the Special Displacement Method described in the papers Phys. Rev. Research 2, 013357 (2020) and Phys. Rev. B 94, 075125 (2016). Tutorials on anharmonic lattice dynamics are based on the paper Phys. Rev. B 108, 035155 (2023). It is advisable to check them for the interpretation of the results and description of the main equations related to this tutorial.
The results in this example are obtained with Quantum_ESPRESSO v7.2 and the ZG.x code in EPW.
For this tutorial purposes set the following environment variable in your shell and scripts:
QE=/path_to_q-e/ # this is the path to q-e
Executables in $QE/EPW/ZG/ directory are compiled together with make epw. To use local executables go to $QE/EPW/ZG/src/local and type ./compile_ifort.sh.
In this tutorial we will show how to obtain all input and output files. We also provide inputs as a reference or to speed up the process. Most of the temperature-dependent calculations will be performed for T = 0 K; one can repeat the steps using a different temperature.
Exercise 1: Generation of the ZG configuration and DFT-ZG calculation.
Exercise 2: Temperature-dependent band structures.
Exercise 3: Anharmonic lattice dynamics.
Exercise 4: Temperature-dependent optical spectra.
Exercise 5: Multiphonon diffuse scattering intensity.
Exercise 6: Phonon unfolding.
A complete list of tutorials and files are available in this link.
Exercise 1
The tutorial tarball is located inside the $QE/EPW/ZG/ directory. Untar the tutorial tarball, go to exercise1, and create directory workdir:
tar -xvf tutorial.tar.gz; cd tutorial/exercise1; mkdir workdir
In this exercise we will generate the ZG configuration of silicon in a \(3\times3\times3\) supercell for the temperature T = 0 K and run your first DFT-ZG calculation. In the following, all steps for obtaining the phonons of silicon are provided, but to speed up the process you can skip the first four steps. These steps are standard Quantum Espresso runs for obtaining the interatomic force constants. We note that for generating successfully a ZG configuration you need to make sure that the phonon dispersion is as you would expect (compare with literature). If there exist negative frequencies (soft modes), the code excludes them. If the system is anharmonic one should consider to evaluate anharmonic phonons using A-SDM as in Exercise 3.
Run a self-consistent calculation for silicon in the workdir. For converged results, the energy cutoff ecutwfc should be 30 Ry:
cd workdir; cp ../inputs/si.scf.in .; cp ../inputs/Si.pz-vbc.UPF .
mpirun -np 4 $QE/bin/pw.x -nk 4 < si.scf.in > si.scf.out
Run a ph.x calculation on a homogeneous \(4\times4\times4\) q-point grid using the input:
--                                                                     si.ph.in
Phonons of Silicon
&inputph
   amass(1) = 28.0855,
   prefix   = 'si'
   outdir   = './'
   ldisp    = .true.
   fildyn   = 'si.dyn'
   tr2_ph   = 1.0d-12
   nq1      = 4, nq2 = 4, nq3 = 4
/
which can be found from the inputs directory:
cp ../inputs/si.ph.in .
mpirun -np 4 $QE/bin/ph.x -nk 4 < si.ph.in > si.ph.out
This will generate 8 si.dynX output files containing the dynamical matrix calculated for each irreducible q-point. The list of irreducible q-points is written in the si.dyn0 file.
Run a q2r.x calculation to obtain the interatomic force constants (IFC) file using the input:
--                                                                  q2r.in
&input
 fildyn='si.dyn', flfrc = 'si.444.fc'
/
i.e.:
cp ../inputs/q2r.in .
mpirun -np 1 $QE/bin/q2r.x < q2r.in > q2r.out
This will generate si.444.fc which contains the IFCs. As we will see below, this is the only external input file necessary for running ZG.x.
Run a matdyn.x calculation to check the phonon dispersion using the input file:
--                                                                  matdyn.in
&input
    asr='simple', amass(1)=28.0855,
    flfrc='si.444.fc', fldyn='si.dyn.mat', flfrq='si.freq', fleig='si.dyn.eig',
    q_in_cryst_coord = .false., q_in_band_form = .true.
/
9
0.00  0.00  0.00  100
0.75  0.75  0.00  1
0.25  1.00  0.25  100
0.00  1.00  0.00  100
0.00  0.00  0.00  100
0.50  0.50  0.50  100
0.00  1.00  0.00  100
0.50  1.00  0.00  100
0.50  0.50  0.50  100
and
cp ../inputs/matdyn.in .
mpirun -np 1 $QE/bin/matdyn.x < matdyn.in > matdyn.out
$QE/bin/plotband.x

Input file >  si.freq
Reading    6 bands at    702 k-points
Range:    0.0000  509.7631eV  Emin, Emax, [firstk, lastk] > 0 600
high-symmetry point:  0.0000 0.0000 0.0000   x coordinate   0.0000
high-symmetry point:  0.7500 0.7500 0.0000   x coordinate   1.0607
...
high-symmetry point:  0.5000 0.5000 0.5000   x coordinate   5.3534
output file (gnuplot/xmgr) > si_ph_dispersion.xmgr
bands in gnuplot/xmgr format written to file si_ph_dispersion.xmgr

output file (ps) >
stopping ...
matdyn.x will generate si.freq which contains the phonon frequencies along the specified path in the Brillouin zone. Then we combine si.freq with plotband.x to obtain si_ph_dispersion.xmgr in gnuplot/xmgr format for the phonon dispersion. To plot the phonon dispersion, as shown in Figure 1, type:
cp si_ph_dispersion.xmgr ../gnuplot/.
cd ../gnuplot/; gnuplot gp_coms.p; evince ph_dispersion_444.eps
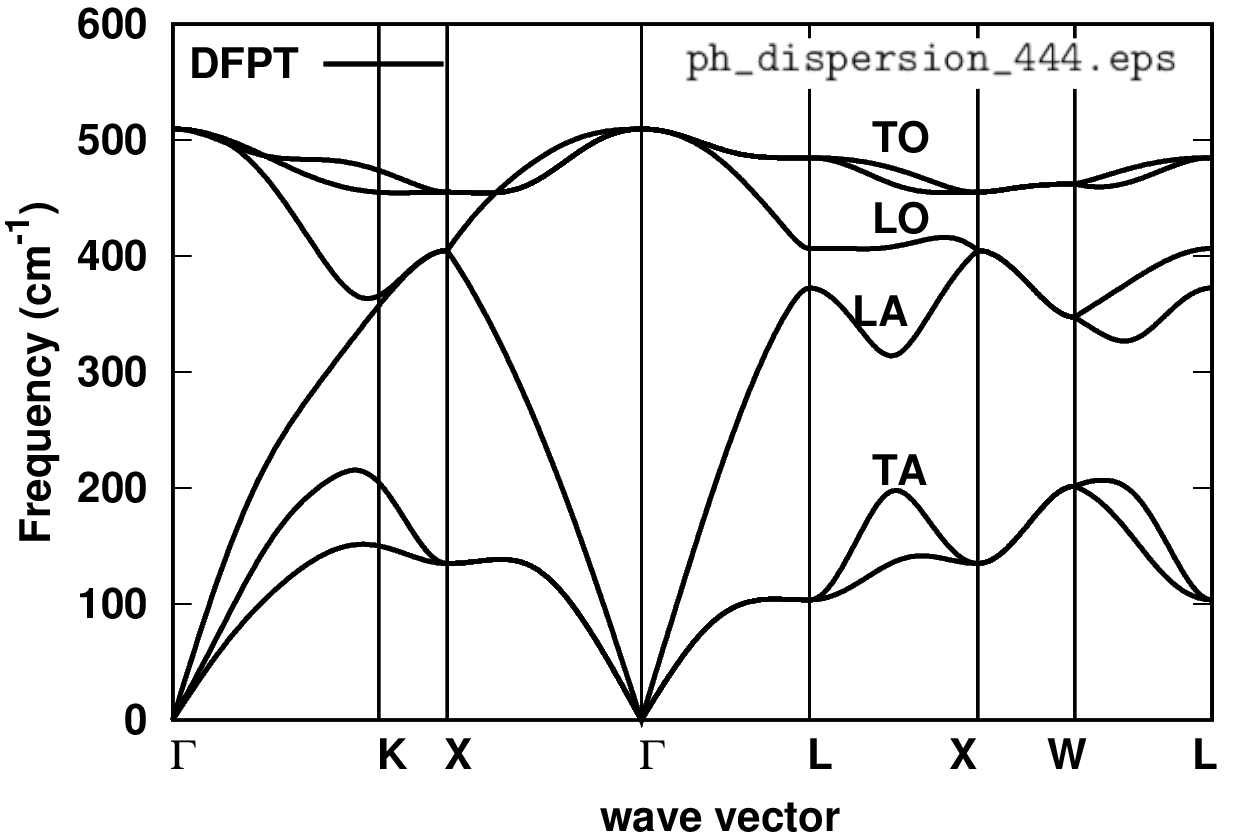
Figure 1: Phonon dispersion relation of silicon.
Is the phonon dispersion the one you would expect? One can verify the results with literature data. Once you have obtained the IFC file (e.g. here si.444.fc) and verified the correctness of your phonons, you are ready to perform a ZG.x calculation. If you have skipped the four steps above, you can copy the IFC file from inputs into workdir:
cd ../workdir; cp ../inputs/si.444.fc .
Run a ZG calculation using the input:
--                                                                       ZG_333.in
&input
    flfrc='si.444.fc',
    asr='simple', amass(1)=28.0855, atm_zg(1) = 'Si',
    T = 0.00,
    dim1 = 3, dim2 = 3, dim3 = 3
    compute_error = .true., synch = .true., error_thresh = 0.035, niters = 15000
    incl_qA = .false.
/
Details about all input flags are provided in https://docs.epw-code.org/doc/InputsZG.html. The q-point grid (nq1 * nq2 * nq3) used to obtain the dynamical matrices should not be necessarily the same with the supercell size (dim1 * dim2 * dim3). In particular, dimX is independent of nqX, since ZG.x takes advantage of Fourier interpolation as implemented in matdyn.x; thus any size of ZG configuration can be generated from si.444.fc.
cp ../inputs/ZG_333.in .
mpirun -np 4 $QE/bin/ZG.x -nk 4 < ZG_333.in > ZG_333.out
The outputs from this ZG.x run are: (a) ZG-configuration_0.00K.dat and equil_pos.dat which contain the ZG (quantum nuclei at 0 K) and equilibrium (classical nuclei at 0 K) coordinates in angstroms, and (b) ZG-scf_333_0.00K.in and equil-scf_333.in which are the corresponding scf files for performing calculations in a \(3\times3\times3\) supercell.
Run a self-consistent calculation for silicon with the nuclei clamped at their equilibrium and ZG coordinates (for T = 0.00 K) in the supercell:
mpirun -np 54 $QE/pw.x -nk 3 < equil-scf_333.in > equil-scf_333.out
mpirun -np 56 $QE/pw.x -nk 8 < ZG-scf_333_0.00K.in > ZG-scf_333_0.00K.out
The input file equil-scf_333.in is also provided here:
&control                                               equil-scf_333.in
    calculation = 'scf'
    restart_mode = 'from_scratch',
    prefix = 'equil-si',
    pseudo_dir = './',
    outdir='./'
 /
 &system
    ibrav = 0
    nat = 54
    ntyp = 1
    ecutwfc = 20.00
    occupations = 'fixed'
    smearing = 'gaussian'
    degauss = 0.0D+00
 /
 &electrons
    diagonalization = 'david'
    mixing_mode= 'plain'
    mixing_beta = 0.70
    conv_thr = 0.1D-06
 /
ATOMIC_SPECIES
 Si  28.086  Si.pz-vbc.UPF
K_POINTS automatic
  2   2   2   0   0   0
CELL_PARAMETERS {angstrom}
     -8.09641133      0.00000000      8.09641133
      0.00000000      8.09641133      8.09641133
     -8.09641133      8.09641133      0.00000000
ATOMIC_POSITIONS (angstrom)
   Si    0.00000000   0.00000000   0.00000000
   Si   -1.34940189   1.34940189   1.34940189
   Si   -2.69880378   0.00000000   2.69880378
...
Note
Cell parameters, number of atoms, k-grid, and atomic coordinates have been modified automatically based on the supercell dimensions. The code will always generate the lattice information in angstroms.
The file ZG-scf_333_0.00K.in is also provided here:
&control                                          ZG-scf_333_0.00K.in
  calculation = 'scf'
  restart_mode = 'from_scratch'
  prefix = 'ZG-0.00K-si'
  pseudo_dir = './'
  outdir = './'
/
&system
  ibrav = 0
  nat =   54
  ntyp =    1
  ecutwfc =  20.00
  occupations = 'fixed'
  smearing = 'gaussian'
  degauss =   0.0D+00
/
&electrons
  diagonalization = 'david'
  mixing_mode= 'plain'
  mixing_beta = 0.70
  conv_thr =   0.1D-06
/
ATOMIC_SPECIES
   Si   28.085 Si.pz-vbc.UPF
K_POINTS automatic
   2   2   2   0   0   0
CELL_PARAMETERS (angstrom)
     -8.09641133      0.00000000      8.09641133
      0.00000000      8.09641133      8.09641133
     -8.09641133      8.09641133      0.00000000
ATOMIC_POSITIONS (angstrom)
   Si      -0.02610870     -0.00524574      0.02749582
   Si      -1.36329713      1.31619849      1.42481245
   Si      -2.75218400     -0.00549830      2.71681282
...
Note
Same information with equil-scf 333.in, except for the prefix and atomic positions. In general, you should add nosym = .true., since symmetries do not apply after ZG displacements. The information printed by the code for constructing these scf files is basic; so for more complex cases one can modify the files based on their calculation needs.
Let us now discuss some apsects about the generation of the ZG-configuration file. Type:
grep -3 "Optimum" ZG_333.out | tail -4
This prints:
Optimum configuration found !

Sum of diagonal terms per q-point:    0.419087
Error and niter index:    0.032411    7403
This information is printed by ZG.x when the optimum configuration is found. Line 3 gives the sum of all diagonal terms per q-point, representing the denominator of Eq. (54) in Phys. Rev. Research 2, 013357, (2020). The first entry in line 4 represents the value of the minimization function E(S_{q,ν}) given by Eq. (54) in Phys. Rev. Research 2, 013357, (2020). The integer in line 4 represents the number of attempts required to achieve E(S_{q,ν}) smaller than the value specified for error_thresh flag. If this number exceeds the integer specified by niters flag, then ZG.x will stop without printing the ZG-configuration file. A general rule is: the larger the supercell, the fewer attempts are required to achieve E(S_{q,ν}) < error_thresh. The reason is: the order of choosing the unique set of signs, assigned to the q-points, is less important as we approach the thermodynamic limit.
Now type:
head -3 ZG-configuration_0.00K.dat
This prints:
   Temperature is:     0.00  K
Atomic positions          54
  Si      -0.02610870     -0.00524574      0.02749582
Lines 1 and 2 give the temperature for which ZG displacements are generated and the total number of atomic coordinates, respectively. In line 3, we have the first ZG atomic coordinate. It is
perfectly reasonable to find different ZG coordinates, since the modes obtained by diagonalizing the dynamical matrix can differ by a phase factor (or a unitary matrix in case of degeneracy) if the processor, or compiler, or libraries have changed. The eigenvalues, of course, should remain the same in all cases. The flag synch = .true. should apply a smooth Berry connection and align the sign of the modes with respect to a reference mode, but the sign of this reference depends on the machine. Degeneracy is not taken into account. The best way to check the validity of your configuration is by comparing the anisotropic mean-squared displacement tensor with the exact values, both obtained at the end of the ZG_333.out. To this aim type:
grep -12 "Anisotropic" ZG_333.out | tail -13
This prints:
Anisotropic mean-squared displacement tensor vs exact values (Ang^2):
Atom 1
 Si    0.002243   0.002332   0.002322
      Exact values
 Si    0.002352   0.002352   0.002352
Atom 2
 Si    0.002529   0.002407   0.002277
      Exact values
 Si    0.002352   0.002352   0.002352

 off-diagonal terms
 Si    0.000189   0.001294   0.000610
 Si    0.000652  -0.000851   0.000027
Reducing error_thresh brings the anisotropic displacement tensor closer to the exact values.
Now check whether the calculations have finished and type:
grep ! equil-scf_333.out
grep ! ZG-scf_333_0.00K.out
This prints:
equil-scf_333.out:!    total energy              =    -427.83892824 Ry
ZG-scf_333_0.00K.out:!    total energy              =    -427.72018072 Ry
These are the total energies (Kohn-Sham potential energy surfaces) of the equilibrium and ZG structures. What is the reason of the difference between these two values? The difference is ΔE = 0.1187 Ry and is due to the vibrational potential energy. To check this type:
grep -5 "Potent" ZG_333.out
This prints:
==============================================

Total vibrational energy:    0.24020789  Ry

        Potential energy:    0.12010394  Ry

          Kinetic energy:    0.12010394  Ry

 Vibrational free energy:    0.24020789  Ry
Our computed ΔE is indeed almost equal to half the total vibrational energy, since a DFT calculation will not account for the vibrational kinetic energy contribution. The value 0.119 deviates from 0.12, since (i) we exclude from our calculations the q-points belonging in set A and (ii) due to the error coming by using small ZG configurations. As we use larger supercells this small deviation reduces to zero and ΔE = Total vibrational energy / 2. The code also prints the vibrational free energy evaluated using Eq. (A5) of Phys. Rev. B 108, 035155 (2023). The information for the vibrational free energy is important for checking the convergence of the trial free energy in A-SDM calculations (Exercise 3).
For the next exercises we will only need the charge-density files from equil-si.save and ZG-0.00K-si.save. Thus remove:
rm -r *wfc* si.save _ph0/ equil-si.save/*wfc* ZG-0.00K-si.save/*wfc*
Exercise 2
In this exercise we will learn how to calculate the phonon-induced band gap renormalization and temperature-dependent band structures using the example of silicon and the math:3times3times3 ZG supercell. To obtain temperature-dependent band structures we will employ the band structure unfolding (BSU) technique with plane-waves as basis sets. The theory of BSU with plane-waves is described in Phys. Rev. B 85, 085201 (2012). To speed up the process one can skip the following two steps.
First go to the directory exercise2 and copy the following input files in your workdir:
cd ../../exercise2/; mkdir workdir; cd workdir
cp ../inputs/Si.pz-vbc.UPF .; cp ../inputs/si.scf.in .
cp ../inputs/si.bands.in .; cp ../inputs/bands.in .
In file si.bands.in we set nbnd = 5 to include one empty band. We also sample the Γ-X path using 50 k-points in Cartesian coordinates (units of 2 pi/a).
Run a standard band structure calculation in the unit-cell of silicon along Γ-X using 50 k-points:
mpirun -np 4 $QE/bin/pw.x -nk 4 < si.scf.in > si.scf.out
mpirun -np 4 $QE/bin/pw.x -nk 4 < si.bands.in > si.bands.out
mpirun -np 4 $QE/bin/bands.x -nk 4 < bands.in > bands.out
Plot the band structure as shown in Figure 2 using the file bands.dat.gnu:
cp bands.dat.gnu ../gnuplot/; cd ../gnuplot/; gnuplot gp_coms.p
evince band_structure.eps
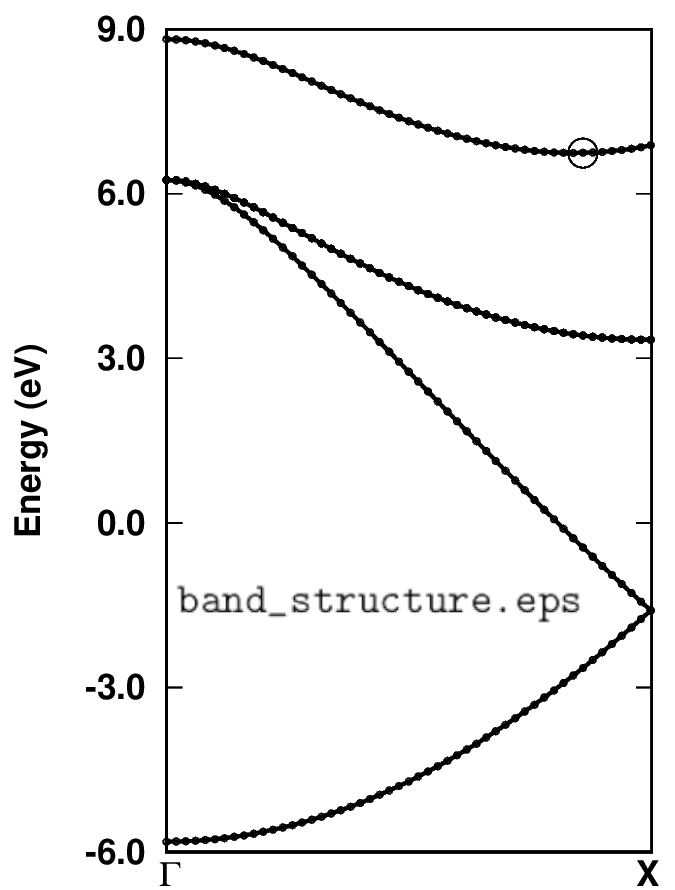
Figure 2: Band structure of silicon along Γ-X using 50 k-points.
Can you find the k-coordinates of the valence band maximum (VBM) and conduction band minimum (CBM)? Inspecting file bands.dat, those are:
0.000000  0.000000  0.000000
-5.811    6.253    6.253    6.253    8.817
...
0.000000  0.840000  0.000000
-2.783   -0.278    3.440    3.440    6.743
We can see that the VBM lies at the Γ-point and is threefold degenerated with energy E_VBM = 6.253 eV. The CBM lies at ~0.84 Γ-X with energy E_CBM = 6.743 eV. Therefore, the DFT-LDA band gap with these settings is E_G = E_CBM - E_VBM = 0.49 eV.
Run a non self-consistent calculation for two K-points that define the VBM and CBM in the equilibrium and ZG supercell structures. The selection rule is to find the reciprocal lattice vector of the supercell G that maps K onto k, i.e. K = k - G. The trivial choice is G = Γ and thus set K = k.
To prepare the calculation proceed as follows:
cd ../workdir/
cp ../../exercise1/workdir/equil-scf_333.in equil-nscf_333.in
cp ../../exercise1/workdir/ZG-scf_333_0.00K.in ZG-nscf_333_0.00K.in
cp -r ../../exercise1/workdir/equil-si.save/ .
cp -r ../../exercise1/workdir/ZG-0.00K-si.save/ .
In equil-nscf_333.in and ZG-nscf_333_0.00K.in apply the following changes:
1. calculation = 'nscf'
2. nbnd = 135 # i.e. include one empty band / unit-cell
3. Replace the automatic K-grid:
    K_POINTS automatic
    2 2 2 0 0 0
   with the two K-points of the VBM and CBM:
    K_POINTS crystal
    2
    0.000000 0.000000 0.000000 1
    0.000000 1.260000 1.260000 1

4. For ZG input file add nosym = .true. after nbnd = 135.
Since the coordinates are given in units of the reciprocal lattice parameters, we obtain the K-coordinates by multiplying the k-coordinates of VBM and CBM states with the dimensions of the supercell, i.e. if k = [ x y z] then K = [ \(m \times x n \times y p \times z\) ], where integers \(m, n, p\) define an \(m \times n \times p\) supercell.
If you did not complete Exercise 1 and the steps above, then copy the files from the inputs directory:
cd ../workdir/; cp ../inputs/*nscf_333*in .; cp -r ../inputs/*-si.save/ .
For example the ZG input file should look like this:
&control                                             ZG-nscf_333_0.00K.in
  calculation = 'nscf'
  restart_mode = 'from_scratch'
  prefix = 'ZG-0.00K-si'
  pseudo_dir = './'
  outdir = './'
/
&system
  ibrav = 0
  nat =   54
  ntyp =    1
  ecutwfc =  20.00
  nbnd = 135
  nosym = .true.
  occupations = 'fixed'
  smearing = 'gaussian'
  degauss =   0.0D+00
/
&electrons
  diagonalization = 'david'
  mixing_mode= 'plain'
  mixing_beta = 0.70
  conv_thr =   0.1D-06
/
ATOMIC_SPECIES
   Si   28.085 Si.pz-vbc.UPF
K_POINTS crystal
2
0.000000 0.000000 0.000000 1
0.000000 1.260000 1.260000 1
CELL_PARAMETERS (angstrom)
     -8.09641133      0.00000000      8.09641133
      0.00000000      8.09641133      8.09641133
     -8.09641133      8.09641133      0.00000000
ATOMIC_POSITIONS (angstrom)
...
Then run:
mpirun -n 28 $QE/pw.x -nk 2 < equil-nscf_333.in > equil-nscf_333.out
mpirun -n 28 $QE/pw.x -nk 2 < ZG-nscf_333_0.00K.in > ZG-nscf_333_0.00K.out
The calculations should take around 5 secs each. When the equilibrium calculation is finished, check that you obtain the VBM and CBM energies you would expect. To this aim type:
grep highest equil-nscf_333.out
It prints
highest occupied, lowest unoccupied level (ev): 6.2534 6.7435
Indeed we obtained the correct VBM and CBM energies.
To find the band gap renormalization from the ZG calculation type:
grep -41 "End of band" ZG-nscf_333_0.00K.out | tail -40
Can you find the energy of the VBM and CBM? You should find that there is a splitting of the originally threefold degenerated VBM of about 10 meV. The degeneracy splitting results from the ZG displacements in a finite size supercell and should reduce to zero for larger ZG simulation cells. This is a consequence of the harmonic approximation, where the symmetries of the system should be maintained upon thermal averaging (see thermal ellipsoids in Figure 3).
We note that to minimize the effect of band degeneracy splitting we exclude the modes in set A. In Phys. Rev. Research 2, 013357, (2020) we show that these modes dominate VBM splitting (see the spectral function in Figure 3), giving ΔE > 80 meV for a \(4\times4\times4\) ZG supercell. Hence, for finite size systems with degenerated band edges, it is suggested to keep incl_qA = .false.. To deal with this finite size supercell artefact, we determine the VBM renormalization by taking the average of the three bands. Our analysis yields: E_VBM = (6.2740 + 6.2863 + 6.2920)/3 = 6.2841 eV. Thus the band gap at T = 0 K is E(0 K) = 6.7250 - 6.2841 = 0.4409 eV, and we can determine a zero-point renormalization E_ZPR = 0.49 - 0.4409 = 49 meV. This value is in good agreement with literature data [check, for example, J. Chem. Phys. 143, 102813 (2015) and New J. Phys. 20, 123008 (2018)].
In general, for obtaining reliable values for the zero-point renormalization, you should always check convergence with respect to the ZG supercell size (see the right plot in Figure 3).
Before going to the next step remove unnecessary files:
rm -r *wfc* *save
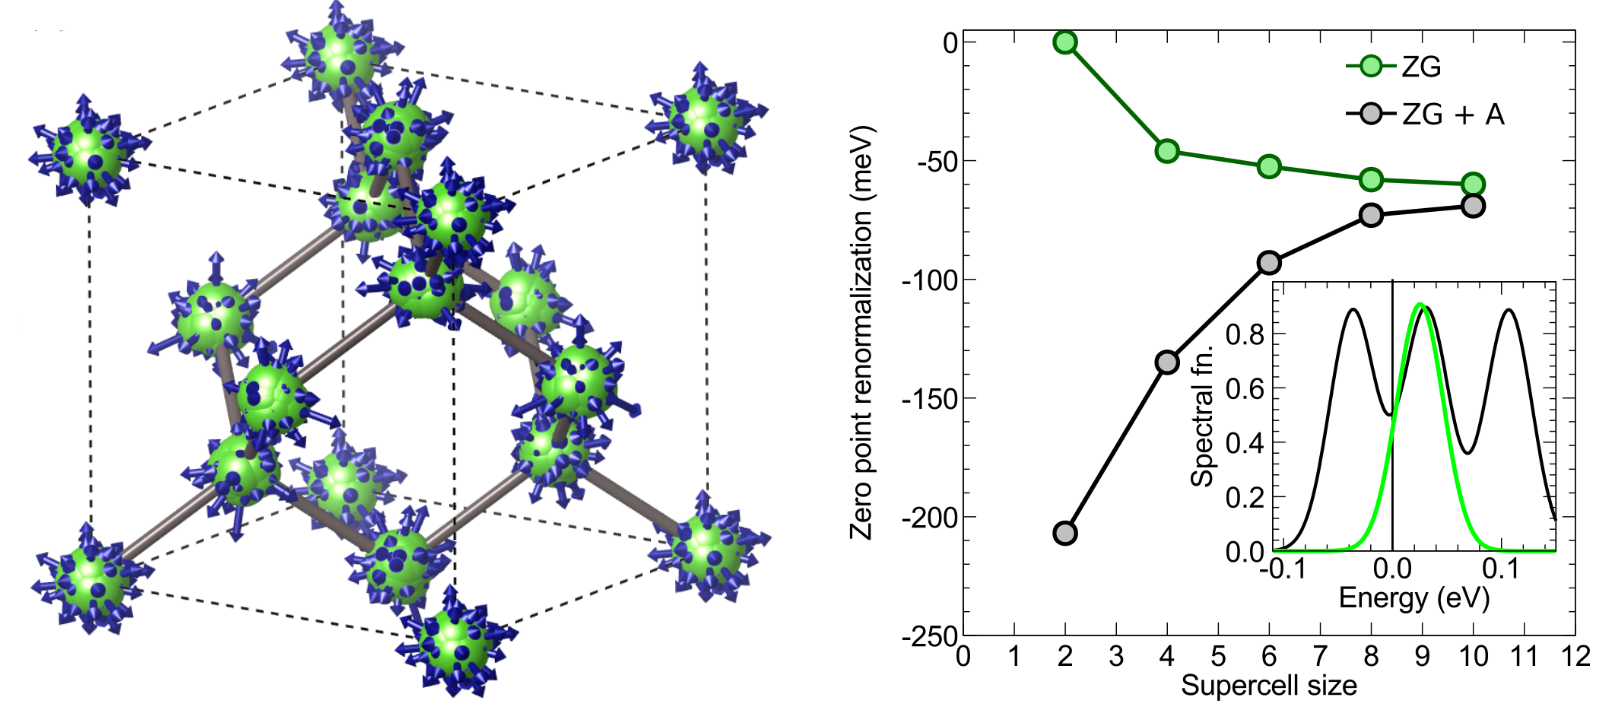
Figure 3: Left: Thermal ellipsoids of silicon obtained by folding the nuclei of a \(50\times50\times50\) ZG configuration back to the unit-cell. Arrows represent the ZG displacements. Right: Convergence of the zero-point renormalization of silicon as a function of supercell size. Green and black discs represent data obtained using ZG configurations generated with and without modes in set A, respectively. In the inset we show the corresponding spectral functions calculated using the band structure unfolding technique.
Now prepare a band structure unfolding calculation using the \(3\times3\times3\) ZG configuration. Create a new directory and copy the necessary input files:
mkdir band_structure_unfolding/; cd band_structure_unfolding/
cp ../../inputs/bands_unfold.in bands.in; cp ../../inputs/Si.pz-vbc.UPF .
cp -r ../../../exercise1/workdir/ZG-0.00K-si.save/ .
cp ../ZG-nscf_333_0.00K.in ZG-bands_333_0.00K.in
In ZG-bands_333_0.00K.in apply the following modifications:
 1. calculation = 'bands'
 2. Replace the following lines containing information about the K-points:
   K_POINTS crystal
   2
   0.000000 0.000000 0.000000 1
   0.000000 1.260000 1.260000 1
with
   K_POINTS crystal_b
   2
   0.000000 0.000000 0.000000 35
   0.000000 1.500000 1.500000 1
Here we choose to sample the Gamma-X path with 36 equally-spaced K-points. If you did not complete the previous step, then copy:
cp ../../inputs/ZG-bands_333_0.00K.in .
The file ZG-bands_333_0.00K.in should look like this:
 &control                                          ZG-bands_333_0.00K.in
  calculation = 'bands'
  restart_mode = 'from_scratch'
  prefix = 'ZG-0.00K-si'
  pseudo_dir = './'
  outdir = './'
/
&system
  ibrav = 0
  nat =   54
  ntyp =    1
  ecutwfc =  20.00
  nbnd = 135
  nosym = .true.
  occupations = 'fixed'
  smearing = 'gaussian'
  degauss = 0.0D+00
/
&electrons
  diagonalization = 'david'
  mixing_mode= 'plain'
  mixing_beta = 0.70
  conv_thr =   0.1D-06
/
ATOMIC_SPECIES
   Si   28.085 Si.pz-vbc.UPF
K_POINTS crystal_b
2
0.000000 0.000000 0.000000 35
0.000000 1.500000 1.500000 1
CELL_PARAMETERS {angstrom}
     -8.09641133      0.00000000      8.09641133
      0.00000000      8.09641133      8.09641133
     -8.09641133      8.09641133      0.00000000
ATOMIC_POSITIONS {angstrom}
...
We also show here the file bands.in:
--                                               bands.in
&bands
 prefix  = 'ZG-0.00K-si'
 outdir  = './'
 filband = 'bands.dat'
 lsym    = .false.
 dim1    = 3,
 dim2    = 3,
 dim3    = 3
/
The input variables in bands.in are the same as in a standard bands.x calculation. The only difference is the flags dimX used to specify the dimensions of the ZG supercell.
Now run a band structure unfolding calculation:
mpirun -n 56 $QE/pw.x -nk 28 < ZG-bands_333_0.00K.in > ZG-bands_333_0.00K.out
mpirun -n 28 $QE/bands_unfold.x < bands.in > bands.out
Note that parallelization over k-points in bands_unfold.x is not implemented. The bands calculation should take around 50 secs and the unfolding around 1 sec. Now read the outputs of bands01.dat and spectral_weights01.dat. Can you guess what’s the meaning of the spectral weights for each band? The files bands01.dat and spectral_weights01.dat, containing the band energies, E_m (K, T), and spectral weights, P_m ( K, k, T), for all K-points, respectively. Now you have all the ingredients to evaluate the spectral function given by Eq. (61) of Phys. Rev. Research 2, 013357, (2020).
Now calculate the spectral function using the energies and spectral weights. To this aim convert first bands01.dat and spectral_weights01.dat into a different format using plot_bands.x of QE:
cp ../../../inputs/energies.in .
cp ../../../inputs/spectral_weights.in .
$QE/bin/plotband.x spectral_weights01.dat < spectral_weights.in > spw.out
$QE/bin/plotband.x bands01.dat < energies.in > energies.out
sed -i '/^\s*$/d' spectral_weights.dat # remove empty lines
sed -i '/^\s*$/d' energies.dat # remove empty lines
paste energies.dat spectral_weights.dat > tmp
awk '{print $1,$2,$4}' tmp > energies_weights.dat; rm tmp
You have just generated energies_weights.dat file in a similar format to a “.gnu” file where the first column has the momentum-axis values, the second the energies, and the third the spectral weights. Now proceed with the calculation of the spectral function:
cp ../../../inputs/energies_weights.dat . # if you missed the step above
cp ../../../inputs/pp_spctrlfn.in .
The file pp_spctrlfn.in takes the following input variables:
--                                                            pp_spctrlfn.in
&input
  flin   = 'energies_weights.dat'
  steps  = 4725,
  ksteps = 200,
  esteps = 200,
  kmin   = 0,
  kmax   = 1.0,
  emin   = 3.00
  emax   = 9.00
  flspfn = 'spectral_function.dat'
/
Here, (i) steps is the number of rows in the input file flin, (ii) ksteps and esteps define the resolution of the spectral function along the momentum-axis and energy-axis, (iii) kmin - kmax and emin - emax define the momentum and energy windows, and (iv) in flspfn we provide the name of the output file.
Now calculate the spectral function using pp_spctrlfn.x and plot:
mpirun -n 4 $QE/bin/pp_spctrlfn.x -nk 4 < pp_spctrlfn.in > pp_spctrlfn.out
cp spectral_function.dat ../../../gnuplot/. ; cd ../../../gnuplot/
cp ../inputs/bands.dat.gnu .
gnuplot gp_pm3d.p; evince bsu_si_0K.eps
We also copied bands.dat.gnu for comparing the spectral function with the band structure calculated with the atoms at their equilibrium positions (white dots in Figure 4). In the right part of Figure 4, we also reproduced the converged calculation from Phys. Rev. Research 2, 013357, (2020), employing an \(8\times8\times8\) ZG supercell, more K-points, and empty bands.
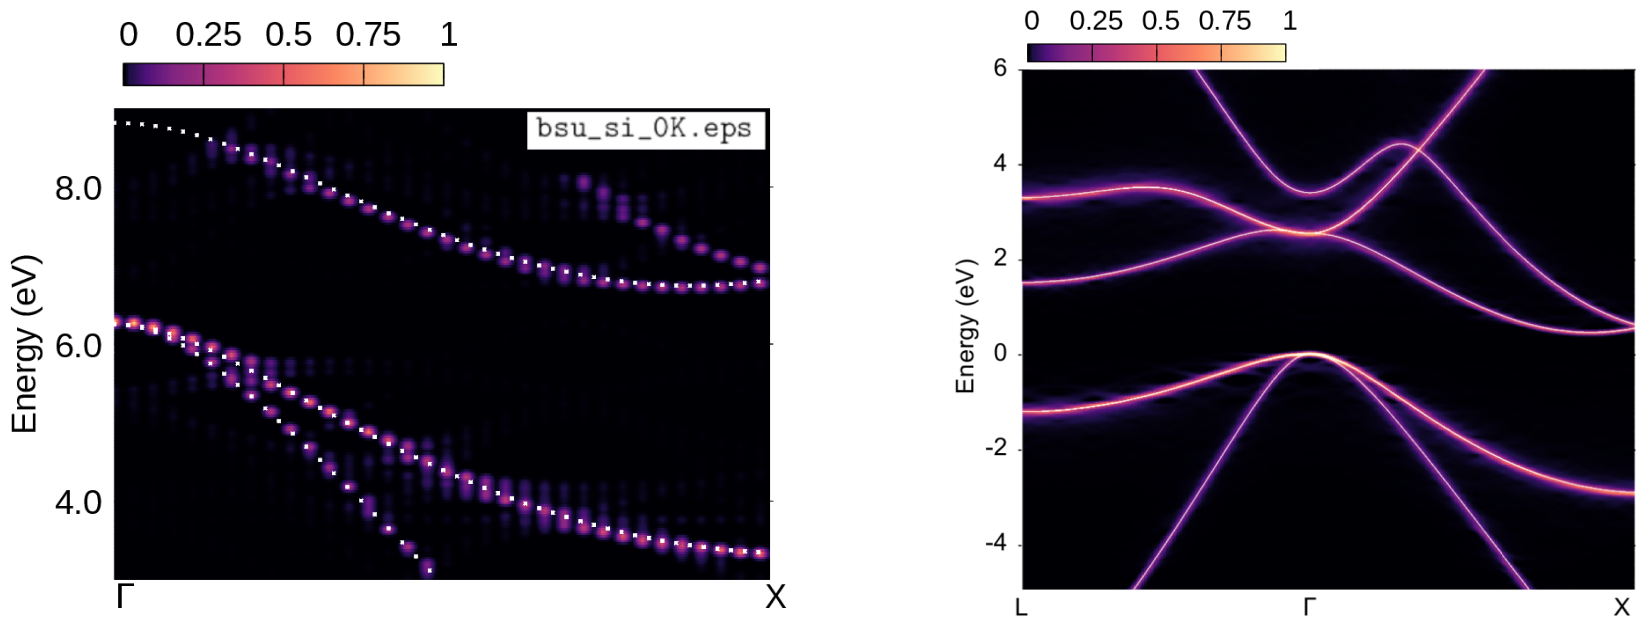
Figure 4: Left: Spectral function of silicon along Γ-Χ using a \(3\times3\times3\) ZG configuration generated for T = 0 K. Right: Converged result as reported in Phys. Rev. Research 2, 013357, (2020).
Exercise 3a
In this exercise we will learn how to calculate temperature-dependent anharmonic phonons of Zr at T=1188 K using \(2\times2\times2\) ZG supercells and the anharmonic special displacement method (A-SDM). A-SDM combines the special displacement method with the self-consistent phonon (SCP) theory; details for the theory related to this exercise please refer to Phys. Rev. B 108, 035155 (2023) and D. Hooton, LI. a new treatment of anharmonicity in lattice thermodynamics: I, London Edinburgh Philos. Mag. J. Sci. 46, 422 (1955). The main aim is to find the effective matrix of interatomic force constants (IFCs) C that best describes anharmonicity in the potential energy surface U. For this reason we minimize the trial free energy with respect to the matrix of IFCs which requires, essentially, to solve self-consistently the following equation:
In the following we are going to show how to solve the above equation self-consistently by performing a series of finite difference calculations.
First go to the directory exercise3 and copy the following input files in your workdir:
cd ../../exercise3/; mkdir workdir; cd workdir
cp ../inputs/Zr.upf ../inputs/scf.in ../inputs/ph.in .
cp ../inputs/q2r.in ../inputs/matdyn.in .
Below we provide the scf.in file:
&control                                                scf.in
    calculation='scf'
    restart_mode='from_scratch'
    prefix = 'scf'
    outdir='./'
    pseudo_dir='./'
    verbosity='high'
/
&system
    ibrav=3
    nat=1
    ntyp=1
    ecutwfc=  30
    A = 3.51695
    occupations = 'smearing'
    smearing='gaussian',
    degauss=0.005d0
/
&electrons
    diagonalization='david'
    mixing_mode='plain'
    mixing_beta=0.7
    conv_thr=1e-7
/
ATOMIC_SPECIES
Zr 91.224 Zr.upf
K_POINTS {automatic}
6 6 6 0 0 0
ATOMIC_POSITIONS (crystal)
Zr 0.0 0.0 0.0
Note that Gaussian smearing is used for the occupations since Zr is a metal. For speed up we use a small energy cutoff of 30 Ry.
Now run a self-consistent calculation for Zr in the workdir:
mpirun -np 56 $QE/pw.x -nk 14 < scf.in > scf.out
Run a ph.x calculation on a homogeneous \(3\times3\times3\) q-point grid using:
mpirun -np 56 $QE/ph.x -nk 14 < ph.in > ph.out
The ph.in is provided below:
--                                                       ph.in
&inputph
   amass(1)= 91.224,
   prefix = 'scf'
   outdir = './'
   verbosity = 'high'
   ldisp = .true.
   fildyn = 'Zr.dyn'
   tr2_ph = 1.0d-14
   nq1 = 3
   nq2 = 3
   nq3 = 3
/
This will generate 4 Zr.dynX output files containing the dynamical matrix calculated for each irreducible q-point. The list of irreducible q-points is written in the Zr.dyn0 file. Now run a q2r.x calculation to obtain the IFCs file using:
mpirun -np 1 $QE/q2r.x < q2r.in > q2r.out
The q2r.in is also provided:
--                                                     q2r.in
&input
 fildyn='Zr.dyn', zasr='crystal', flfrc = 'Zr.333.fc'
/
This will generate Zr.333.fc which contains the harmonic IFCs.
Now run a matdyn.x calculation to obtain the harmonic phonon dispersion using:
mpirun -np 1 $QE/matdyn.x < matdyn.in > matdyn.out
The matdyn.in is provided:
--                                                                                   matdyn.in
&input
    &input
    asr='crystal', amass(1)= 91.224,
    flfrc='Zr.333.fc', fldyn=' ', flfrq='Zr_harm.freq', fleig=' ', q_in_cryst_coord = .true.
    q_in_band_form = .true.
/
5
 0.00   0.00   0.00 100
 0.50   0.50   0.50 100
 0.75   0.25  -0.25 100
 0.00   0.00   0.00 100
 0.50   0.50   0.00 1
Then obtain the phonon dispersion using:
$QE/plotband.x

Input file > Zr_harm.freq
Reading    3 bands at    401 k-points
Range: -131.7185  166.3237eV  Emin, Emax, [firstk, lastk] > -200 200
high-symmetry point:  0.0000 0.0000 0.0000   x coordinate   0.0000
high-symmetry point:  0.0000 0.0000 1.0000   x coordinate   1.0000
high-symmetry point:  0.5000 0.5000 0.5000   x coordinate   1.8660
high-symmetry point:  0.0000 0.0000 0.0000   x coordinate   2.7321
high-symmetry point:  0.0000 0.5000 0.5000   x coordinate   3.4392
output file (gnuplot/xmgr) > Zr_harm_ph_dispersion.xmgr
output file (ps) >
stopping ...
matdyn.x will generate Zr_harm.freq which contains the harmonic phonon frequencies. Then we combine Zr_harm.freq with plotband.x to obtain Zr_harm_ph_dispersion.xmgr in gnuplot/xmgr format for the harmonic phonon dispersion. To plot the phonon dispersion type:
cp Zr_harm_ph_dispersion.xmgr ../gnuplot/.
cd ../gnuplot/; gnuplot gp_coms_harm.p; evince Zr_harm_ph_dispersion.pdf
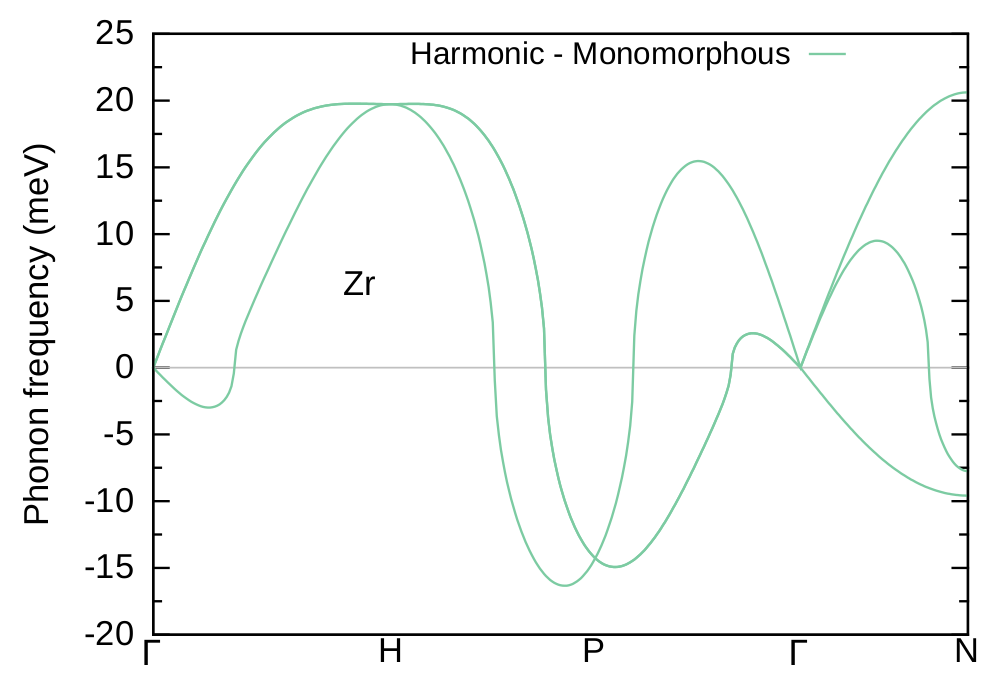
Figure 5: Harmonic phonon dispersion relation of bcc Zr.
Is the matrix of IFCs positive definite (i.e. all phonon frequencies are positive)? Unlike Si phonon dispersion in Exercise 1 , the answer is no and the phonon dispersion exhibits severe instabilities. Here the harmonic approximation is not enough since anharmonic effects are important in Zr. To treat anharmonicity we are going to use the A-SDM.
The starting point of A-SDM for obtaining self-consistent phonons is a crucial step towards convergence and stability. This is because the SCP theory is designed to work with positive definite IFCs matrices. Although one could employ the harmonic phonons as a starting point (and neglect imaginary phonons), we strongly suggest the use of stable phonons as a starting point. For systems with a double well potential like Zr, well-defined dispersions can be obtained by exploring the ground state polymorphous structure, i.e a low-symmetry structure whose energy corresponds to a minimum of the potential energy surface [see also Phys. Rev. B 101, 155137 (2020)].
In the following we are going to show how to obtain the ground state polymorphous network of Zr and its stable phonons. If you have skipped the steps above, you can copy the harmonic IFCs file from inputs into workdir and run an A_ZG calculation:
cd ../workdir; cp ../inputs/Zr.333.fc .
cp ../inputs/ZG_1.in .
$QE/ZG.x < ZG_1.in > ZG_1.out
The input is provided here:
--                                                     ZG_1.in
&input
   asr='crystal', amass(1)= 91.224, flfrc='Zr.333.fc'
   flscf = 'scf.in'
   atm_zg(1) = 'Zr',
   T = 0
   dim1 = 2, dim2 =2, dim3 =2, incl_qA = .true.
   compute_error = .true., synch = .true., error_thresh = 0.2
   ASDM = .true.
/
&A_ZG
   poly = .true.
   poly_fd_forces = .false.
/
Note
The q-point grid nq1 * nq2 * nq3 used to obtain the initial dynamical matrices should not be necessarily the same with the supercell size (dim1 * dim2 * dim3). In particular, dimX is independent of nqX, since ZG.x takes advantage of Fourier interpolation as implemented in matdyn.x; thus any size of ZG configuration can be generated from Zr.333.fc.
The input format of &input list in ZG_1.in is the same as we have seen in Exercise 1. We remark that here we are using a \(2\times2\times2\) supercell and therefore incl_qA = .true.. The temperature is set initially to T = 0, since we want to explore the polymorphous geometry. Line 7 contains the flag ASDM which enables the A-SDM procedure and allows the code to read the input variables in the list &A_ZG. At this step we ask the code by turning poly = .true. to generate the input file for performing a coordinates’ optimization of the structure that will lead to the polymorphous geometry. Apart from the standard ZG.x output files described in Exercise 1, the code now prints ZG-relax.in. This file contains displaced coordinates of the atoms away from their high-symmetry positions (that define the monomorphous network) in a \(2\times2\times2\) supercell using ZG displacements.
The file ZG-relax.in is provided here:
 &control                                          ZG-relax.in
  calculation = relax
  restart_mode = 'from_scratch'
  prefix = 'ZG-relax'
  pseudo_dir = './'
  outdir = './'
  tprnfor=.true.
  disk_io = 'none'
  forc_conv_thr = 1.0D-5
  nstep = 300
/
&system
  ibrav = 0
  nat =    8
  ntyp =    1
  ecutwfc =  30.00
  occupations = 'smearing'
  smearing = 'gaussian'
  degauss =   0.5D-02
/
&electrons
  diagonalization = 'david'
  mixing_mode= 'plain'
  mixing_beta = 0.70
  conv_thr =   0.1D-06
/
&ions
  ion_dynamics = 'bfgs'
/
ATOMIC_SPECIES
   Zr   91.224 Zr.upf
K_POINTS automatic
   3   3   3   0   0   0
CELL_PARAMETERS (angstrom)
      3.51695000      3.51695000      3.51695000
     -3.51695000      3.51695000      3.51695000
     -3.51695000     -3.51695000      3.51695000
ATOMIC_POSITIONS (angstrom)
...
Note
Cell paramaters, number of atoms, k-grid, and atomic coordinates have been modified automatically based on the supercell dimensions. The code will always generate the lattice information in angstroms.
Now run nuclei coordinates optimization for Zr with the nuclei clamped at their ZG harmonic coordinates (for T = 0.00 K) in the \(2\times2\times2\) supercell.
mpirun -np 56 $QE/pw.x -nk 14 < ZG-relax.in > ZG-relax.out
The calculation should take around 3 minutes. Meanwhile you can check how the total energy evolves by typing grep ! ZG-relax.out. Can you compare the total energy of the relaxed polymorphous structure with the one of the monomorphous structure (unit cell) calculation in scf.out? The polymorpous network is more stable by 27 meV/f.u.
Now run an A_ZG calculation using the same input file:
cp ../inputs/ZG_1.in ZG_2.in
$QE/ZG.x < ZG_2.in > ZG_2.out
The code now will search for the output file ZG-relax.out, read the relaxed final coordinates, and apply finite differences. This will generate ZG-scf_poly_iter_00_XXXX.in files corresponding to the scf inputs for evaluating the IFCs of the polymorphous network by finite differences. The default displacement on each atom is 0.01058 Å (i.e. 0.02 Bohr). One can change the default value by specifying a value in Å, using the flag fd_displ under the namelist &A_ZG.
Run scf calculations for the files ZG-scf_poly_iter_00_XXXX.in and save all scf outputs in the folder fd_forces:
file=ZG-scf_poly_iter_00
mkdir fd_forces/
for i in {0001..0048}; do
  mkdir $i
  cd $i
  cp ../Zr.upf .
  mv ../"$file"_"$i".in .
  mpirun -np 56 $QE/pw.x -nk 14 < "$file"_"$i".in > "$file"_"$i".out
  mv "$file"_"$i".out ../fd_forces/.
  rm Zr.upf
  cd ../
done
Each scf run should take around 3 seconds and the total calculation around 6 minutes. Now run an A_ZG calculation using the same input file but turn the flag poly_fd_forces = .true..
cp ../inputs/ZG_3.in ZG_3.in
$QE/ZG.x < ZG_3.in > ZG_3.out
ZG_3.in is also provided:
--                                                       ZG_3.in
&input
   asr='crystal', amass(1)= 91.224, flfrc='Zr.333.fc'
   flscf = 'scf.in'
   atm_zg(1) = 'Zr',
   T = 0
   dim1 = 2, dim2 =2, dim3 =2, incl_qA = .true.
   compute_error = .true., synch = .true., error_thresh = 0.3
   ASDM = .true.
/
&A_ZG
   poly = .true.
   poly_fd_forces = .true.
   incl_epsil = .false.
/
The code now will read all the forces from the files ZG-scf_poly_iter_00_XXXX.out in fd_forces and evaluate the IFCs of the polymorphous structure. Apart from the standard ZG.x output files, the code now prints: (i) FORCE_CONSTANTS_poly_iter_00 which contains the IFCs in the same format as phonopy, (ii) FORCE_CONSTANTS_sym_poly_iter_00 which contains the symmetrized IFCs (i.e. after applying all symmetry operations of the crystal), and (iii) poly_iter_00.fc which contains the symmetrized IFCs in the same format as q2r.x output, ready to be used for the next A-SDM iteration. You can check the symmetries found by the code using grep "Sym." ZG_3.out or read ZG_3.out directly. For systems where the dielectric constant and Born effective charges are not zero, one may include this information in the XXXX.fc file by setting incl_epsil = .true.. Note that for including the non-analytic contribution to the dynamical matrix one needs to set na_ifc = .true. for the next ZG iteration run &input list. This is because the IFCs are evaluated by finite differences instead of DFPT. The same flag is also necessary for obtaining the phonon dispersion with matdyn.x; if not included the calculation will lead to erroneous results. An example is given for the case of PbTe in Exercise 3b
Run a matdyn.x calculation to obtain the harmonic phonons of the Zr polymorphous network:
cp ../inputs/matdyn_poly.in .
mpirun -np 1 $QE/matdyn.x < matdyn_poly.in > matdyn_poly.out
$QE/plotband.x
matdyn.x will generate Zr_poly.freq which contains the harmonic phonon frequencies of the Zr polymorphous network. Then combine Zr_poly.freq with plotband.x to create the phonon dispersion file Zr_poly_ph_dispersion.xmgr as before. To plot the new phonon dispersion type:
cp Zr_poly_ph_dispersion.xmgr ../gnuplot/.
cd ../gnuplot/; gnuplot gp_coms_poly.p; evince Zr_poly_ph_dispersion.pdf
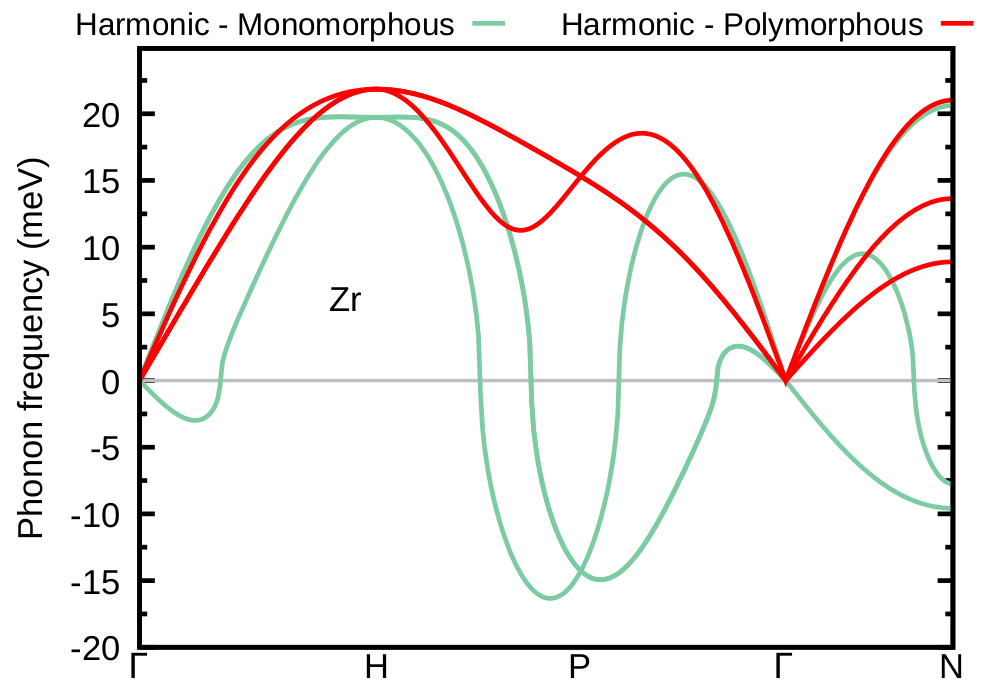
Figure 6: Comparison of the harmonic phonon dispersion of polymorphous and monomorphous Zr.
In this case, the matrix of IFCs is positive definite (i.e. all phonon frequencies are positive) and we are ready to account for anharmonicity via A-SDM using as a starting point the symmetrized IFCs of the Zr polymorphous network.
Proceed to run an A_ZG calculation using:
cd ../workdir; cp ../inputs/ZG_4.in ZG_4.in
$QE/ZG.x < ZG_4.in > ZG_4.out
The input file should look like this:
--                                                       ZG_4.in
&input
   asr='crystal', amass(1)= 91.224, flfrc='poly_iter_00.fc'
   flscf = 'scf.in'
   atm_zg(1) = 'Zr',
   T = 1188
   dim1 = 2, dim2 =2, dim3 =2, incl_qA = .true.
   compute_error = .true., synch = .true., error_thresh = 0.3
   ASDM = .true.
   fd = .true.
/
&A_ZG
   iter_idx = 1
   apply_fd = .true.
/
This is essentially the first iteration indicated by iter_idx = 1. The file of IFCs is now flfrc='poly_iter_00.fc' and the target temperature is T= 1188 K. We also use fd = .true. to specify that IFCs have been calculated using finite differences. ZG.x will generate a ZG configuration on which the method of finite differences is applied after setting the flag apply_fd = .true.. The scf files are ZG-scf_1188.00K_iter_01_XXXX.in to be used for the evaluation of the temperature-dependent IFCs of the configuration generated using ZG displacements for T= 1188 K.
Run scf calculations for the files ZG-scf_1188.00K_iter_01_XXXX.in and save all scf outputs in the folder fd_forces. The script below is as before but with a new name for file variable.
file=ZG-scf_1188.00K_iter_01
mkdir fd_forces/
for i in {0001..0048}; do
  mkdir $i
  cd $i
  cp ../Zr.upf .
  mv ../"$file"_"$i".in .
  mpirun -np 56 $QE/pw.x -nk 14 < "$file"_"$i".in > "$file"_"$i".out
  mv "$file"_"$i".out ../fd_forces/.
  rm Zr.upf
  cd ../
done
Each scf run should take around 3 seconds and the total calculation around 6 minutes.
Read the calculated forces with an A_ZG calculation using:
cp ../inputs/ZG_5.in ZG_5.in
$QE/ZG.x < ZG_5.in > ZG_5.out
The input file reads:
--                                                 ZG_5.in
&input
   asr='crystal', amass(1)= 91.224, flfrc='poly_iter_00.fc'
   flscf = 'scf.in', atm_zg(1) = 'Zr',
   T = 1188
   dim1 = 2, dim2 =2, dim3 =2, incl_qA = .true.
   compute_error = .true., synch = .true., error_thresh = 0.3
   ASDM = .true.
/
&A_ZG
   iter_idx0 = 0, iter_idx = 1
   apply_fd = .false.
   read_fd_forces = .true.
   mixing = .true.
   incl_epsil = .false.
/
The flag apply_fd is set to .false. since apply_fd and read_fd_forces cannot be both true. With the flag read_fd_forces = .true. the code reads all the forces from files ZG-scf_1188.00K_iter_01_XXXX.out in the folder fd_forces and evaluates the IFCs of the ZG configuration. If one scf calculation is not successful, then the code will complain and print the error:
%%%%%%%%%%%%%%%%%%%%%%%%%%%%%%%%%%%%%%%%%%%%%%%%%%%%%%%%%%%%%%%%%%%%%%%%%%%%%%
Error in routine ZG (XXXX):
forces in file are missing ...
%%%%%%%%%%%%%%%%%%%%%%%%%%%%%%%%%%%%%%%%%%%%%%%%%%%%%%%%%%%%%%%%%%%%%%%%%%%%%%
Here XXXX will be replaced by the code with the file index of the unsuccessful calculation. If all calculations run successfully, the code evaluates the IFCs using the finite differences formula and prints the following new files related to the first iteration: (i) FORCE_CONSTANTS_1188.00K_iter_01, (ii) FORCE_CONSTANTS_sym_1188.00K_iter_01 and (iii) 1188.00K_iter_01.fc which contains the symmetrized IFCs in the same q2r.x output format, ready to be used for the next A-SDM iteration. Here, we set the flag mixing = .true., so that iterative mixing of the IFCs is performed. The input variables iter_idx0 and iter_idx denote the initial and final index of iterations, respectively, for which mixing of IFCs is performed.
Now run matdyn.x to obtain the temperature-dependent anharmonic phonons of the first iteration:
cp ../inputs/matdyn_01.in .
mpirun -np 1 $QE/matdyn.x < matdyn_01.in > matdyn_01.out
$QE/plotband.x
matdyn.x will generate Zr_01.freq which contains the temperature-dependent anharmonic phonon frequencies of Zr at the first iteration. Then combine Zr_01.freq with plotband.x to create the phonon dispersion file Zr_01_ph_dispersion.xmgr as before. To plot the new phonon dispersion and compare with the previous results type:
cp Zr_01_ph_dispersion.xmgr ../gnuplot/.
cd ../gnuplot/; gnuplot gp_coms_iter_01.p; evince Zr_01_ph_dispersion.pdf
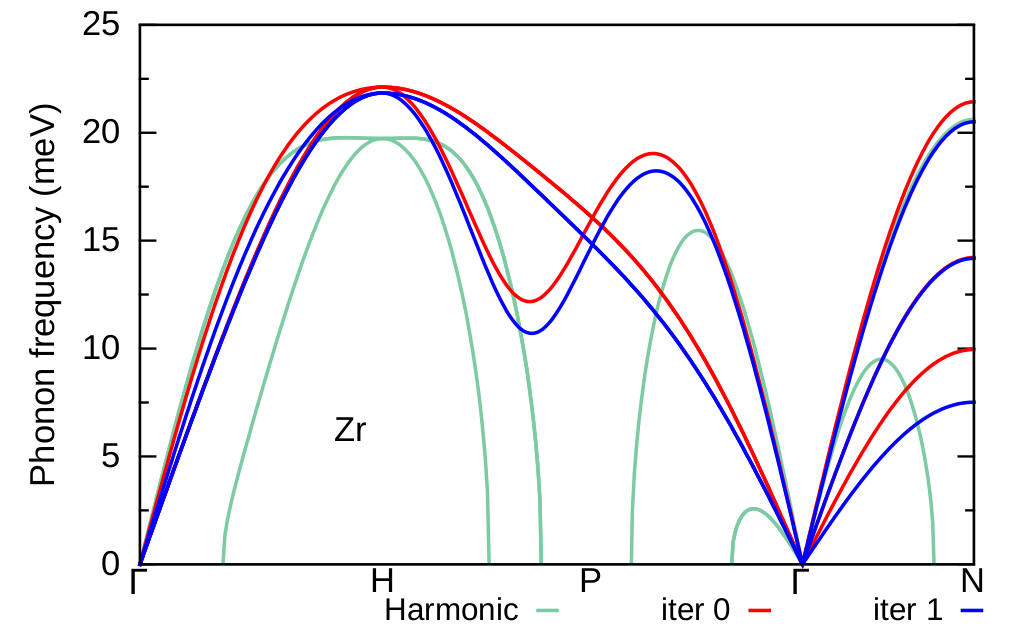
Figure 7: Comparison of the phonon dispersion of Zr at T=1188 K obtained at the first iteration (blue) with the phonon dispersion of the polymorphous network (red) and the harmonic phonon dispersion (green).
As we can see the result from the first iteration follows a similar trend with the one calculated for the polymorphous network. In the following, we proceed to the second iteration and re-evaluate the phonon dispersion of Zr at T= 1188 K starting from the IFCs of the previous iteration.
Run an A_ZG calculation using:
cd ../workdir; cp ../inputs/ZG_6.in ZG_6.in
$QE/ZG.x < ZG_6.in > ZG_6.out
The input file should look like this:
--                                                      ZG_6.in
&input
   asr='crystal', amass(1)= 91.224, flfrc='1188.00K_iter_01.fc'
   flscf = 'scf.in'
   atm_zg(1) = 'Zr',
   T = 1188
   dim1 = 2, dim2 =2, dim3 =2, incl_qA = .true.
   compute_error = .true., synch = .true., error_thresh = 0.35
   ASDM = .true.
   fd = .true.
/
&A_ZG
   iter_idx = 2
   apply_fd = .true.
/
This will generate a new ZG configuration and the scf files ZG-scf_1188.00K_iter_02_XXXX.in to be used for the evaluation of the temperature-dependent IFCs of the second iteration. In a similar spirit, run scf calculations for files ZG-scf_1188.00K_iter_02_XXXX.in and save all scf outputs in the folder fd_forces.
file=ZG-scf_1188.00K_iter_02
mkdir fd_forces/
for i in {0001..0048}; do
  mkdir $i
  cd $i
  cp ../Zr.upf .
  mv ../"$file"_"$i".in .
  mpirun -np 56 $QE/pw.x -nk 14 < "$file"_"$i".in > "$file"_"$i".out
  mv "$file"_"$i".out ../fd_forces/.
  rm Zr.upf
  cd ../
done
Now read the forces of iteration 2 using:
cp ../inputs/ZG_7.in ZG_7.in
$QE/ZG.x < ZG_7.in > ZG_7.out
The input file should look like this:
--                                                      ZG_7.in
&input
   asr='crystal', amass(1)= 91.224, flfrc='1188.00K_iter_01.fc'
   flscf = 'scf.in', atm_zg(1) = 'Zr',
   T = 1188
   dim1 = 2, dim2 =2, dim3 =2, incl_qA = .true.
   compute_error = .true., synch = .true., error_thresh = 0.3
   ASDM = .true.
   fd = .true.
/
&A_ZG
   iter_idx0 = 0, iter_idx = 2
   apply_fd = .false.
   read_fd_forces = .true.
   mixing = .true.
   incl_epsil = .false.
/
The code will read all the forces from the files ZG-scf_1188.00K_iter_02_XXXX.in in fd_forces and evaluate the IFCs of the new ZG configuration. The code now prints all files related to the second iteration: (i) FORCE_CONSTANTS_1188.00K_iter_02, (ii) FORCE_CONSTANTS_sym_1188.00K_iter_02 and (iii) 1188.00K_iter_02.fc. Mixing is performed between the current and all previous IFCs matrices as specified by the input variables iter_idx0 and iter_idx. We found that convergence is achieved faster for the current system. Instead, one can perform mixing between consecutive iterations (current and previous iteration) by choosing appropriately iter_idx0 and iter_idx. In any case the converged result should be similar.
Now run again a matdyn.x calculation to obtain the temperature-dependent anharmonic phonons at the second iteration:
cp ../inputs/matdyn_02.in .
mpirun -np 1 $QE/matdyn.x < matdyn_02.in > matdyn_02.out
$QE/plotband.x
matdyn.x will generate Zr_02.freq which contains the temperature-dependent anharmonic phonon frequencies of Zr at the second iteration. Then combine Zr_02.freq with plotband.x to create the phonon dispersion file Zr_02_ph_dispersion.xmgr as before. To plot the new phonon dispersion and compare with the previous results type:
cp Zr_02_ph_dispersion.xmgr ../gnuplot/.
cd ../gnuplot/; gnuplot gp_coms_iter_02.p; evince Zr_02_ph_dispersion.pdf
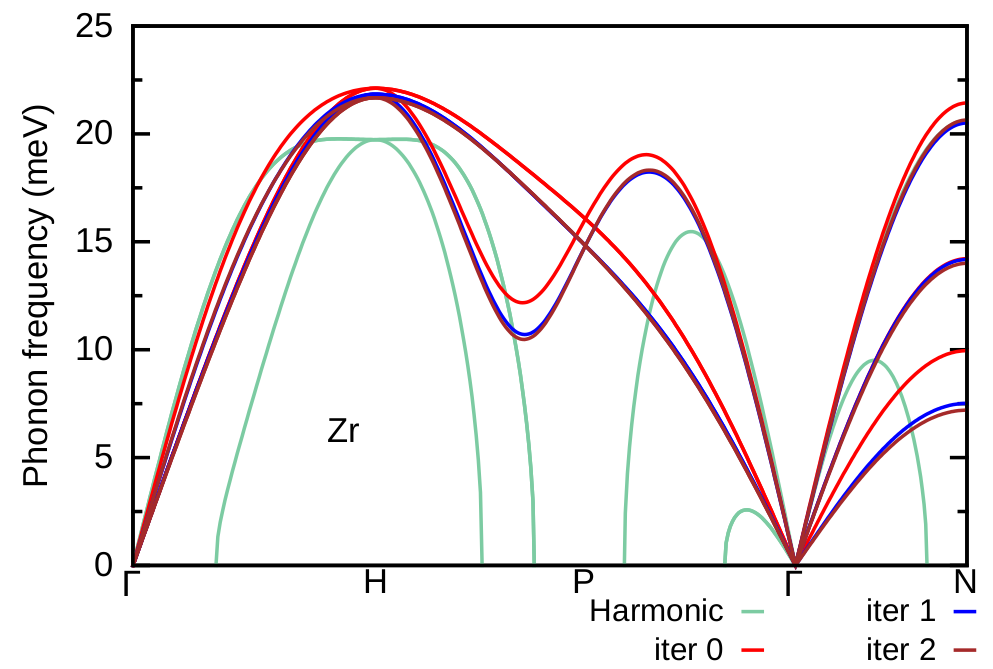
Figure 8: Comparison of the phonon dispersion of Zr at T=1188 K obtained at the second iteration (brown) with the one at the first iteration (blue), the phonon dispersion of the polymorphous network (red) and the harmonic phonon dispersion (green).
As we can see the result at the second iteration is almost converged. One can repeat further iterative steps to check convergence. As a homework repeat the previous steps for the third and fourth iterations. The results should look like the following:
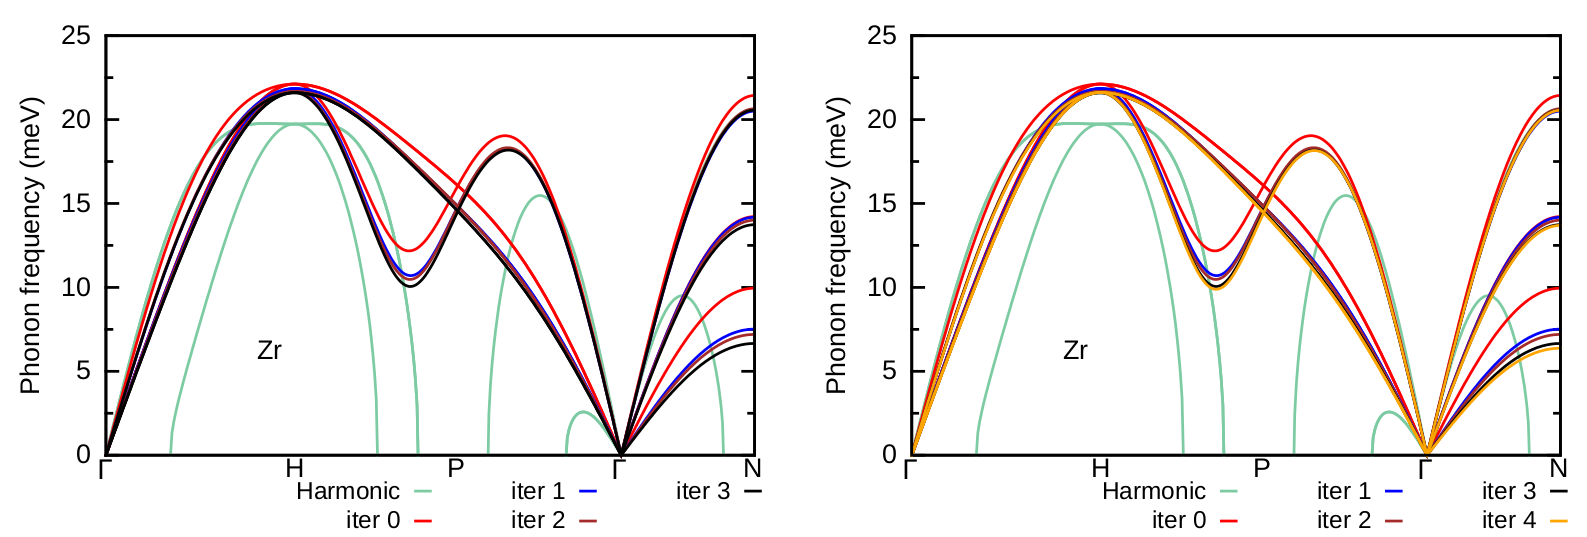
Figure 9: Converged anharmonic phonon dispersion of Zr at T=1188 K as calculated with A-SDM for a \(2\times2\times2\) supercell.
We can readily see that convergence is obtained at the third iteration; note that the result from the first iteration is still in excellent agreement with the converged result. As a homework, also calculate the phonons of Zr at T=1188 K using \(3\times3\times3\) supercells.
HINT: Start the A-SDM procedure from the IFCs of Zr at T=1188 K obtained at the third iteration with \(2\times2\times2\) supercells (i.e. using 1188.00K_iter_03.fc). The result is provided in the plot below.
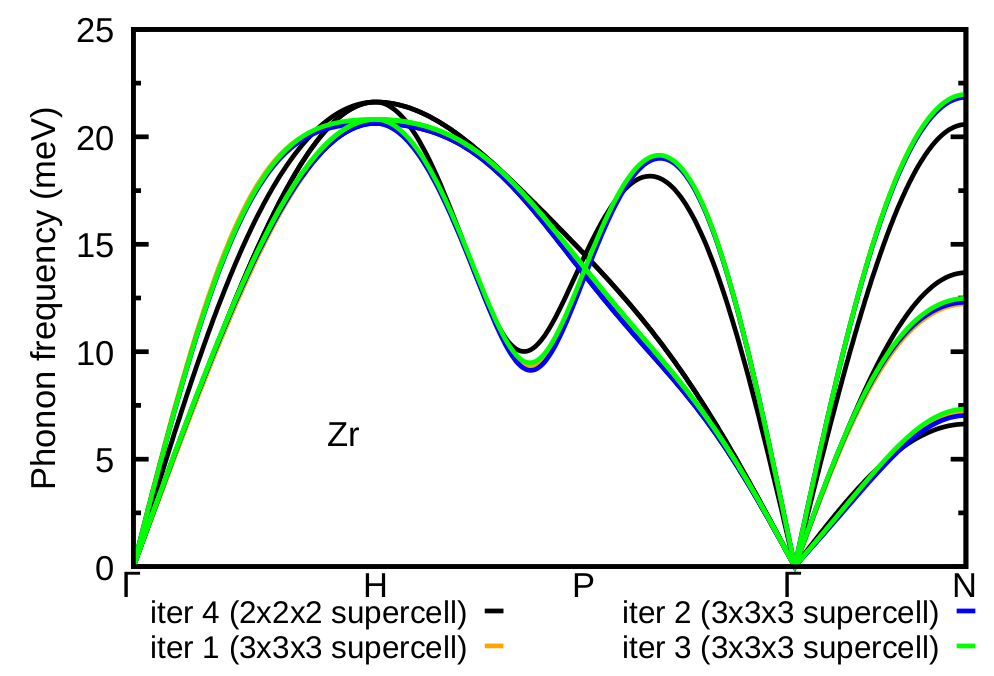
Figure 10: Converged anharmonic phonon dispersion of Zr at T=1188 K as calculated with A-SDM for a \(3\times3\times3\) supercell.
For the convergence of the phonon dispersion when larger supercells are used, please refer to the results in Phys. Rev. B 108, 035155 (2023). Therein, results are obtained using more accurate settings, i.e. denser k-grid and higher kinetic energy cutoff.
To this end we also discuss four final important points:
A quicker and more accurate way than checking the phonon dispersion is to plot the Frobenius norm (\(||.||\)) of the leading component of the IFCs matrix (\(\tilde{C}_{1 1 \alpha, 1 1 \alpha} (T)\)). This information is found from the first \(3\times3\) matrix in FORCE_CONSTANTS_sym_1188.00K_iter_XX, where XX indicates the iteration. We note that convergence in IFCs guarantees essentially minimization of the system’s free energy. The result for a few more iterations is shown below. “iteration -1” corresponds to the harmonic \(||\tilde{C}_{1 1 \alpha, 1 1 \alpha}||\) and the difference is taken with respect to \(|| \tilde{C}_{1 1 \alpha, 1 1 \alpha} (T) ||\) of the last iteration. Note also that IFCs unit has been converted from Ry/Bohr \(^2\) to eV/ Å \(^2\).
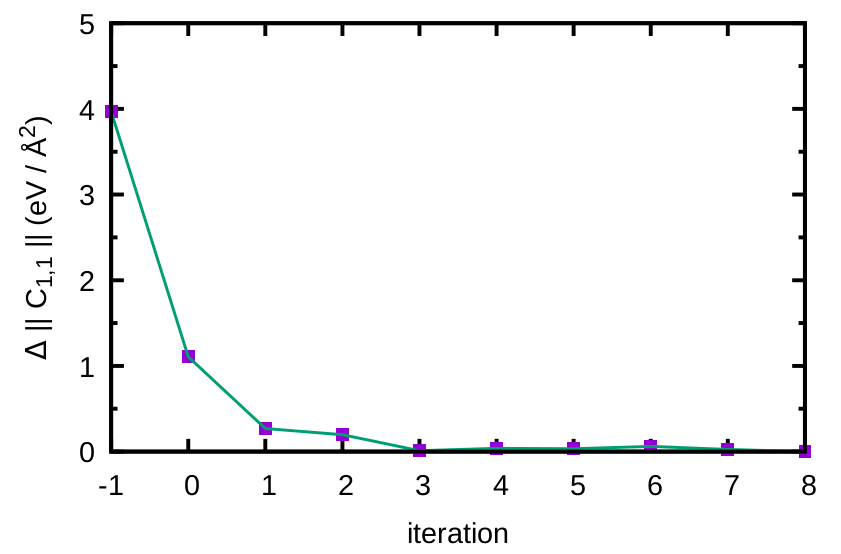
Figure 11: Frobenius norm of the leading component of the IFCs matrix calculated with A-SDM for a \(2\times2\times2\) supercell as a function of iterations.
A full self-consistent phonon theory also minimizes the trial free energy with respect to nuclear coordinates. One can use
ZG.xwhich implements the Newton-Raphson method and find the nuclear coordinates for which \(\big< \partial U / \partial \tau_{\kappa \alpha} \big>_T = 0\). This requires to solve self-consistently the equation:
using at each iterative step the calculated \(\tilde{C}_{p \kappa \alpha, p \kappa \alpha} (T)\). In order to account for this feature in A-SDM we need to set the flag update_equil = .true. when read_fd_forces = .true.. If we use this flag for the case of bcc Zr (point group symmetry \(m\bar{3}m\)), then the code will give \(\tau^{\rm new}_{p \kappa \alpha} (T) = \tau_{p \kappa \alpha} (T)\) (i.e. no change of the nuclear coordinates) at every iterative step. This comes as no surprise since symmetries are enforced and atoms in bcc Zr occupy only special Wyckoff positions. However, for systems containing atoms at general Wyckoff positions, the equation above will give new thermal equilibrium positions at each temperature that contribute to the minimization of the free energy.
Obtaining the polymorphous structure is not a necessary step. We found that this is a very useful step for obtaining positive definite initial IFCs matrix for systems with a double well potential. If the harmonic approximation gives a positive definite initial IFCs matrix, then one could start the iterative procedure without obtaining the polymorphous network. See for example Exercise 3b.
After computing temperature-dependent anharmonic phonons using A-SDM, one could then do a ZG calculation using the new configuration and evaluate anharmonic electron-phonon properties.
Exercise 3b
In this exercise we will learn how to calculate temperature-dependent anharmonic phonons of PbTe at T=300 K using \(2\times2\times2\) ZG supercells and the A-SDM. Unlike Zr, seen in Exercise 3a, PbTe is a polar material and a correction to the dynamical matrix arising from long-range dipole-dipole interactions is essential. Since the A-SDM relies on the computation of IFCs by finite differences, we employ the mixed space approach described in J. Phys.: Condens. Matter 22 202201 (2010), as implemented in matdyn.x. The key flags here to be used are fd = .true., na_ifc = .true., and incl_epsil = .true.. Furthermore, in this example, the harmonic IFCs matrix is positive definite and therefore the computation of the polymorphous structure is not required to initialize the A-SDM procedure.
First go to the directory exercise3 and create workdirb:
cd ../../exercise3/; mkdir workdirb; cd workdirb
Below we provide the scf.in file: :: – scf.in
- &control
calculation=’scf’ restart_mode=’from_scratch’ prefix = ‘scf’ outdir=’./’ pseudo_dir=’/users/zacharia/nc-sr-04_pbesol_standard_upf/’ tstress=.true. tprnfor=.true.
/ &system
ibrav=2 space_group = 225 nat=2 ntyp=2 ecutwfc= 100 A = 6.4440
/ &electrons
diagonalization=’david’ mixing_mode=’plain’ mixing_beta=0.7 conv_thr=1e-9
/ ATOMIC_SPECIES Pb 207.2 Pb.upf Te 127.60 Te.upf K_POINTS {automatic} 8 8 8 0 0 0 ATOMIC_POSITIONS (crystal_sg)
Pb 4b Te 4a
Note
Here we provide the space group of the crystal, as given in the International Tables of Crystallography A (ITA), and the atomic coordinates in Wyckoff positions. This is an alternative way to specify the geometry of the system in Quantum Espresso which ensures that the symmetry of the crystal is respected.
Here we use the PBEsol approximation; the pseudopotential files can be downloaded from the Pseudo-dojo Library.
We also provide the ph.in file:
PbTe                                             ph.in
 &inputph
 prefix = 'scf',
 amass(1) = 207.2
 amass(2) = 127.60
 outdir = './'
 verbosity = 'high'
 ldisp = .true.
 fildyn = 'PbTe.dyn'
 tr2_ph = 1.0d-14
 nq1 = 2
 nq2 = 2
 nq3 = 2
/
q2r.in file:
--                                             q2r.in
&input
 fildyn='PbTe.dyn', zasr='crystal', flfrc = 'PbTe.222.fc'
/
matdyn.x file
--                                             matdyn.in
&input
 asr='crystal',
 flfrc='PbTe.222.fc', fldyn=' ', flfrq='PbTe_harm.freq', fleig=' ', q_in_cryst_coord = .true.
 q_in_band_form = .true.
/
3
0 0.5 0.5 100
0 0.0 0.0 100
0 0.5 0.5 100
Now run a self-consistent and a DFPT calculation for PbTe and obtain the IFCs and harmonic phonon frequencies in the workdirb:
mpirun -np 58 $QE/pw.x -nk 29 < scf.in > scf.out
mpirun -np 58 $QE/ph.x -nk 29 < ph.in > ph.out
mpirun -np 1 $QE/q2r.x < q2r.in > q2r.out
mpirun -np 1 $QE/matdyn.x < matdyn.in > matdyn.out
After the calculation is completed use plotband.x of Quantum Espresso to obtain the phonon dispersion data as an a xmgr file.
$QE/plotband.x

Input file > PbTe_harm.freq
Reading    6 bands at    201 k-points
Range:    0.0000  107.8059eV  Emin, Emax, [firstk, lastk] > 0 110
high-symmetry point:  0.0000 1.0000 0.0000   x coordinate   0.0000
high-symmetry point:  0.0000 0.0000 0.0000   x coordinate   1.0000
high-symmetry point:  0.0000 1.0000 0.0000   x coordinate   2.0000
output file (gnuplot/xmgr) > PbTe_harm_ph_dispersion.xmgr
output file (ps) >
stopping ...
Now plot the phonon dispersion which should look like the one shown in Figure 12.
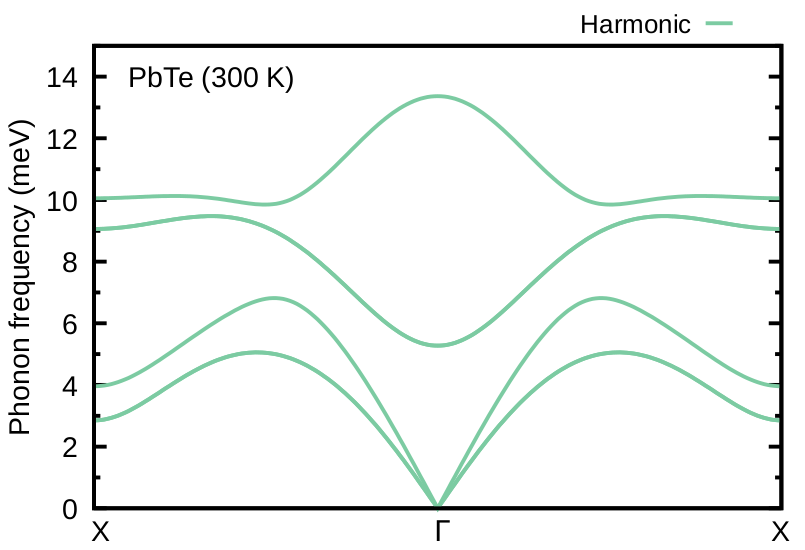
Figure 12: Harmonic phonon dispersion of PbTe.
The matrix of IFCs is positive definite and can be used for initializing the A-SDM procedure. Perform now a ZG.x calculation to generate a \(2\times2\times2\) ZG configuration on which the method of finite differences is applied after setting the flag apply_fd = .true.. The scf files are ZG-scf_300.00K_iter_01_XXXX.in to be used for the evaluation of the temperature-dependent IFCs of the configuration generated using ZG displacements for T= 300 K.
Now run:
$QE/ZG.x < ZG_1.in > ZG_1.out
ZG_1.in is provided here:
--                                                   ZG_1.in
&input
   asr='crystal',
   flscf = 'scf.in'
   flfrc='PbTe.222.fc'
   atm_zg(1) = 'Pb',
   atm_zg(2) = 'Te',
   T = 300
   dim1 = 2, dim2 =2, dim3 =2, incl_qA = .true.
   compute_error = .true., synch = .true., error_thresh = 0.4
   ASDM = .true.
/
&A_ZG
   iter_idx = 1
   apply_fd = .true.
/
Run scf calculations for the files ZG-scf_300.00K_iter_01_XXXX.in and save all scf outputs in the folder fd_forces:
file=ZG-scf_300.00K_iter_01
mkdir fd_forces/
for i in {0001..0096}; do
  mkdir $i
  cd $i
  cp ../Pb.upf .
  cp ../Te.upf .
  mv ../"$file"_"$i".in .
  mpirun -np 36 $QE/pw.x -nk 18 < "$file"_"$i".in > "$file"_"$i".out
  mv "$file"_"$i".out ../fd_forces/.
  rm Pb.upf Te.upf
  cd ../
done
Read the calculated forces with an A_ZG calculation using:
$QE/ZG.x < ZG_2.in > ZG_2.out
The input file reads:
--                                                 ZG_2.in
&input
   asr='crystal',
   flscf = 'scf.in'
   flfrc='PbTe.222.fc'
   atm_zg(1) = 'Pb',
   atm_zg(2) = 'Te',
   T = 300
   dim1 = 2, dim2 =2, dim3 =2, incl_qA = .true.
   compute_error = .true., synch = .true., error_thresh = 0.6
   ASDM = .true.
/
&A_ZG
  iter_idx = 1
  apply_fd = .false.
  read_fd_forces = .true.
  mixing = .false.
  incl_epsil = .true.
/
The flag apply_fd is set to .false. since apply_fd and read_fd_forces cannot be both true. With the flag read_fd_forces = .true. the code reads all the forces from files ZG-scf_300.00K_iter_01_XXXX.out in the folder fd_forces and evaluates the IFCs of the ZG configuration. If all calculations run successfully, the code evaluates the IFCs using the finite differences formula and prints the following new files related to the first iteration: (i) FORCE_CONSTANTS_300.00K_iter_01, (ii) FORCE_CONSTANTS_sym_300.00K_iter_01 and (iii) 300.00K_iter_01.fc which contains the symmetrized IFCs in the same q2r.x output format, ready to be used for the next A-SDM iteration. Here, we set the flag incl_epsil = .true., to write the information of the dielectric constant and Born Effective charges in 300.00K_iter_01.fc. Those should look like this:
T
   31.235827868894          0.000000000000         -0.000000000000
    0.000000000000         31.235827868894          0.000000000000
   -0.000000000000          0.000000000000         31.235827868893
1
  5.7365775      0.0000000      0.0000000
  0.0000000      5.7365775     -0.0000000
 -0.0000000     -0.0000000      5.7365775
2
 -5.7365775     -0.0000000     -0.0000000
 -0.0000000     -5.7365775      0.0000000
 -0.0000000      0.0000000     -5.7365775
Now run matdyn.x to obtain the temperature-dependent anharmonic phonons of the first iteration:
mpirun -np 1 $QE/matdyn.x < matdyn_01.in > matdyn_01.out
$QE/plotband.x
matdyn_01.in is provided here:
--                                                   matdyn_01.in
&input
 asr='crystal',
 flfrc='300.00K_iter_01.fc', fldyn=' ', flfrq='PbTe_01.freq', fleig=' ', q_in_cryst_coord = .true.
 q_in_band_form = .true., fd = .true.,  na_ifc =.true.
/
3
0 0.5 0.5 100
0 0.0 0.0 100
0 0.5 0.5 100
Note
Here we use fd = .true. and na_ifc = .true. since finite differences are used for computing the A-SDM IFCs.
matdyn.x will generate PbTe_01.freq which contains the temperature-dependent anharmonic phonon frequencies of PbTe at the first iteration. Then PbTe_01.freq is combined with plotband.x to create the phonon dispersion file PbTe_01_ph_dispersion.xmgr as before. Now plot the new phonon dispersion and compare with the previous results as shown in Figure 13.
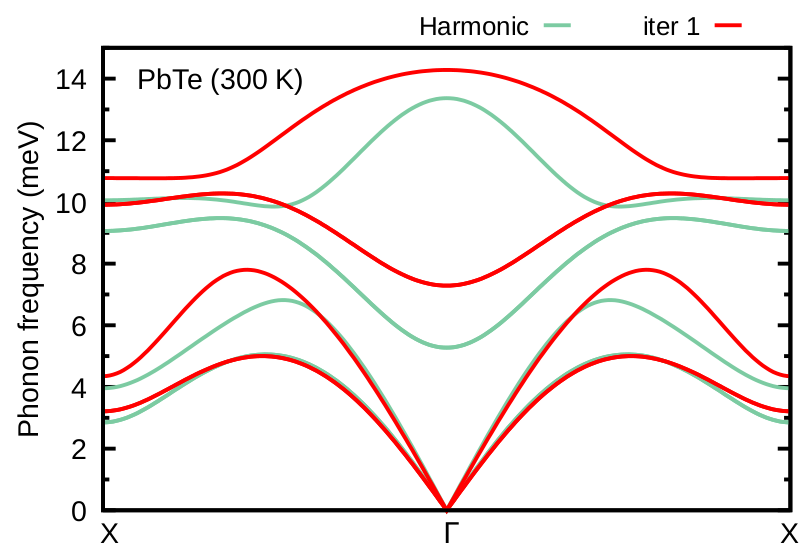
Figure 13: Comparison of the phonon dispersion of PbTe at T=300 K obtained at the first iteration (red) with the harmonic phonon dispersion (green).
Now proceed to the second and third iterations using the same procedure as before for calculating the forces and also apply mixing. The input files are provided below:
ZG_3.in:
--                                                   ZG_3.in
&input
   asr='crystal',
   flscf = 'scf.in'
   flfrc='300.00K_iter_01.fc'
   atm_zg(1) = 'Pb',
   atm_zg(2) = 'Te',
   T = 300
   dim1 = 2, dim2 =2, dim3 =2, incl_qA = .true.
   compute_error = .true., synch = .true., error_thresh = 0.6
   ASDM = .true.
   na_ifc = .true., fd =.true.
/
&A_ZG
   iter_idx = 2
   apply_fd = .true.
/
ZG_4.in:
--                                                   ZG_4.in
&input
  asr='crystal',
  flscf = 'scf.in'
  flfrc='300.00K_iter_01.fc'
  atm_zg(1) = 'Pb',
  atm_zg(2) = 'Te',
  T = 300
  dim1 = 2, dim2 =2, dim3 =2, incl_qA = .true.
  compute_error = .true., synch = .true., error_thresh = 0.6
  ASDM = .true.
  na_ifc = .true., fd =.true.
/
&A_ZG
  iter_idx0 =1, iter_idx = 2
  apply_fd = .false.
  read_fd_forces = .true.
  mixing = .true.
  incl_epsil = .true.
/
matdyn_02.in
--                                                   matdyn_02.in
&input
 asr='crystal',
 flfrc='300.00K_iter_02.fc', fldyn=' ', flfrq='PbTe_02.freq', fleig=' ', q_in_cryst_coord = .true.
 q_in_band_form = .true., na_ifc =.true., fd =.true.
/
3
0 0.5 0.5 100
0 0.0 0.0 100
0 0.5 0.5 100
ZG_5.in:
--                                                   ZG_5.in
&input
  asr='crystal',
  flscf = 'scf.in'
  flfrc='300.00K_iter_02.fc'
  atm_zg(1) = 'Pb',
  atm_zg(2) = 'Te',
  T = 300
  dim1 = 2, dim2 =2, dim3 =2, incl_qA = .true.
  compute_error = .true., synch = .true., error_thresh = 0.6
  ASDM = .true.
  na_ifc = .true., fd =.true.
/
&A_ZG
  iter_idx = 3
  apply_fd = .true.
/
ZG_6.in:
--                                                   ZG_6.in
&input
  asr='crystal',
  flscf = 'scf.in'
  flfrc='300.00K_iter_02.fc'
  atm_zg(1) = 'Pb',
  atm_zg(2) = 'Te',
  T = 300
  dim1 = 2, dim2 =2, dim3 =2, incl_qA = .true.
  compute_error = .true., synch = .true., error_thresh = 0.6
  ASDM = .true.
  na_ifc = .true., fd =.true.
/
&A_ZG
  iter_idx0 =1, iter_idx = 3
  apply_fd = .false.
  read_fd_forces = .true.
  mixing = .true.
  incl_epsil = .true.
/
matdyn_03.in
--                                                   matdyn_03.in
&input
 asr='crystal',
 flfrc='300.00K_iter_03.fc', fldyn=' ', flfrq='PbTe_03.freq', fleig=' ', q_in_cryst_coord = .true.
 q_in_band_form = .true., na_ifc =.true., fd =.true.
/
3
0 0.5 0.5 100
0 0.0 0.0 100
0 0.5 0.5 100
After you finish iteration 2 and 3 plot all phonon dispersions and check for convergence as shown in Figure 14:
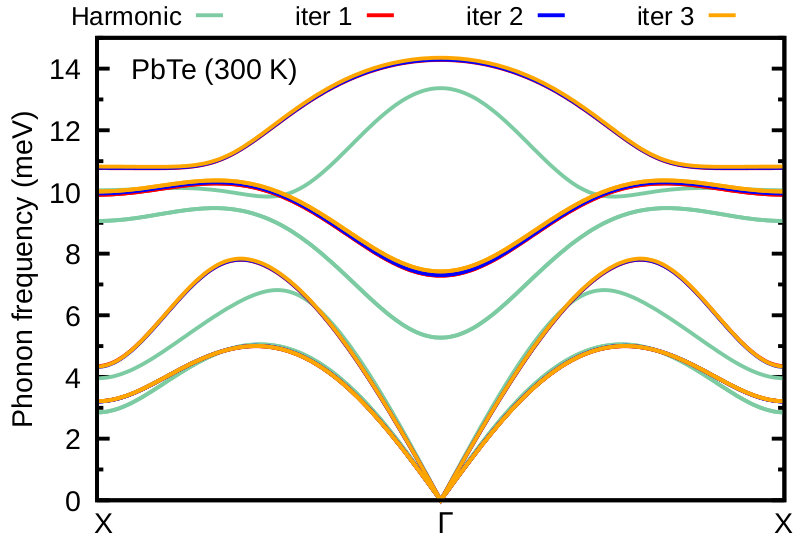
Figure 14: A-SDM phonon dispersions of PbTe at T=300 K obtained at the first (red), second (blue), and third (orange) iterations. The harmonic phonon dispersion (green) is shown for comparison.
Can you repeat now the calculation for T=500 K and T=700 K (first iteration only)? The result should look like as in Figure 15:
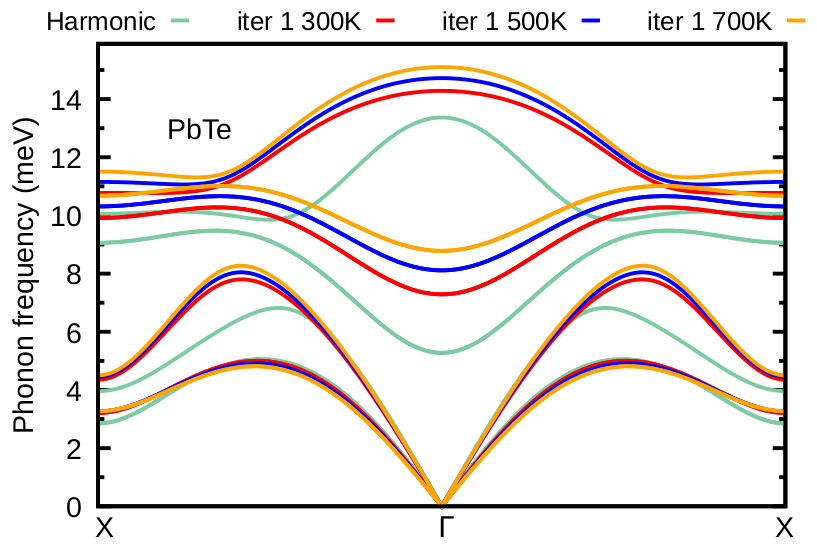
Figure 15: A-SDM phonon dispersions of PbTe at T=300 K (red), T=500 K (blue), and T=700 K (orange) obtained for the first iteration. The harmonic phonon dispersion (green) is shown for comparison.
Exercise 4
In this exercise we will learn how to calculate the phonon-assisted optical spectra using the example of silicon and the \(3\times3\times3\) ZG supercell for T=0 K. To obtain temperature-dependent optical spectra we will evaluate the optical matrix elements in the independent-particle approximation using a routine very similar to epsilon.x of Quantum Espresso. We emphasize that this methodology can be extended to higher-level theories of optical absorption, like RPA, BSE, etc … The present approach of calculating phonon-assisted optical spectra is based on Phys. Rev. B 94, 075125, (2016).
The calculation of phonon-assisted optical spectra using ZG configurations has some drawbacks and advantages when compared to the perturbative methodology implemented in epw.x.
First go to the directory exercise4, create your working directories and copy the input files:
cd ../../exercise4/; mkdir workdir; cd workdir; mkdir equil; mkdir ZG
cd equil
cp ../../inputs/equil/K_list.in .
cp ../../inputs/equil/epsilon.in .
cp ../../inputs/equil/epsi_av.sh .
cp -r ../../../exercise1/workdir/equil-si.save/ .
cp ../../../exercise2/workdir/equil-nscf_333.in .
The file K_list.in contains the crystal coordinates of 200 randomly generated K-points. We use random K-points, instead of a uniform grid, in order to speed up convergence. In equil-nscf_333.in apply the following changes:
1. Add nosym = .true. below nbnd = 135.
2. Delete the information for the K-points:
   K_POINTS crystal
   2
   0.000000 0.000000 0.000000 1
   0.000000 1.260000 1.260000 1
3. At the bottom of the file add the following:
   K_POINTS crystal
   30
4. Copy and paste the first 30 K-points from file K_list.in.
Note
Although we use the equilibrium structure we set nosym = .true. since random K-points are employed.
If you did not complete Exercise 1 and Exercise 2, you can copy:
cp ../../inputs/equil/equil-nscf_333.in .
cp -r ../../../exercise2/inputs/equil-si.save/ .
The file equil-nscf_333.in should look like this:
&control                                               equil-nscf_333.in
  calculation = 'nscf'
  restart_mode = 'from_scratch'
  prefix = 'equil-si'
  pseudo_dir = './'
  outdir = './'
/
&system
  ibrav = 0
  nat =   54
  ntyp =    1
  ecutwfc =  20.00
  nbnd = 135
  nosym = .true.
  occupations = 'fixed'
  smearing = 'gaussian'
  degauss =   0.0D+00
/
&electrons
  diagonalization = 'david'
  mixing_mode= 'plain'
  mixing_beta = 0.70
  conv_thr =   0.1D-06
/
ATOMIC_SPECIES
   Si   28.085 Si.pz-vbc.UPF
CELL_PARAMETERS {angstrom}
     -8.09641133      0.00000000      8.09641133
      0.00000000      8.09641133      8.09641133
     -8.09641133      8.09641133      0.00000000
ATOMIC_POSITIONS {angstrom}
   Si    0.00000000   0.00000000   0.00000000
   Si   -1.34940189   1.34940189   1.34940189
   Si   -2.69880378   0.00000000   2.69880378
...
K_POINTS crystal
30
0.236650 0.022946 0.917156 1.0
0.392728 0.655175 0.471114 1.0
...
We also show here the file epsilon.in:
--                                                    epsilon.in
&inputpp
outdir      = './',
prefix      = 'equil-si',
calculation = 'eps'
/
&energy_grid
smeartype   = 'gauss',
intersmear  = 0.03d0,
wmax        = 4.5d0,
wmin        = 0.2d0,
nw          = 600,
shift       = 0.0d0,
/
The input variables in epsilon.in are the same as in a standard epsilon.x calculation.
Run an optical spectrum calculation for silicon using the \(3\times3\times3\) equilibrium supercell and 30 random K-points. The aim is to calculate the imaginary part of the dielectric function [\(\varepsilon_2(\omega)\)] using Eq. (2) of Phys. Rev. B 94, 075125, (2016). To calculate the dielectric function we use epsilon_Gaus.x, which is a slightly modified routine of epsilon.x, that replaces the delta function with a Gaussian instead of a Lorentzian function. We choose to apply Gaussian broadening in order to minimize numerical artefacts at the absorption onset.
We calculate \(\varepsilon_2(\omega)\) using:
mpirun -n 56 $QE/pw.x -nk 28 < equil-nscf_333.in > equil-nscf_333.out
mpirun -n 28 $QE/epsilon_Gaus.x < epsilon.in > epsilon.out
The full calculation should take around 40 secs. The output files are (i) epsi_equil-si.dat containing \(\varepsilon_2(\omega)\), (ii) epsr_equil-si.dat containing the real part of the dielectric function \(\varepsilon_1(\omega)\), and (iii) eels_equil-si.dat containing the electron energy loss spectrum; all calculated for the equilibrium structure. In each file the first column is the energy grid, and the rest three represent the observable along the three Cartesian directions.
Take the isotropic average of the dielectric function and copy the output file in the gnuplot directory using:
awk '{print $1,($2+$3+$4)/3}' epsi_equil-si.dat > epsi_si_333_equil_30_av.dat
cp epsi_si_333_equil_30_av.dat ../../gnuplot/.
Run an optical spectra calculation for silicon using the \(3\times3\times3\) ZG supercell and 30 random K-points. We will essentially repeat all steps performed for calculating the optical spectra of the \(3\times3\times3\) equilibrium supercell. First go to the ZG directory and copy the input files:
cd ../ZG/
cp ../../inputs/ZG/K_list.in .
cp ../../inputs/ZG/epsilon.in .
cp ../../inputs/ZG/epsi_av.sh .
cp -r ../../../exercise1/workdir/ZG-0.00K-si.save/ .
cp ../../../exercise2/workdir/ZG-nscf_333_0.00K.in .
In ZG-nscf_333_0.00K.in apply the following changes:
1. Delete the information for the K-points:
   K_POINTS crystal
   2
   0.000000 0.000000 0.000000 1
   0.000000 1.260000 1.260000 1
2. At the bottom of the file add the following:
   K_POINTS crystal
   30
3. Copy and paste the first 30 K-points from file K_list.in.
If you did not complete Exercise 1 and Exercise 2 you can copy ZG-0.00K.save and
ZG-nscf_333_0.00K.in from inputs directory, i.e.:
cp ../../inputs/ZG/ZG-nscf_333_0.00K.in ; cp -r ../../../exercise2/inputs/ZG-0.00K-si.save/ .
The file ZG-nscf_333_0.00K.in should look like this:
&control                                          ZG-nscf_333_0.00K.in
  calculation = 'nscf'
  restart_mode = 'from_scratch'
  prefix = 'ZG-0.00K-si'
  pseudo_dir = './'
  outdir = './'
/
&system
  ibrav = 0
  nat =   54
  ntyp =    1
  ecutwfc =  20.00
  nbnd = 135
  nosym = .true.
  occupations = 'fixed'
  smearing = 'gaussian'
  degauss =   0.0D+00
/
&electrons
  diagonalization = 'david'
  mixing_mode= 'plain'
  mixing_beta = 0.70
  conv_thr =   0.1D-06
/
ATOMIC_SPECIES
   Si   28.085 Si.pz-vbc.UPF
CELL_PARAMETERS {angstrom}
     -8.09641133      0.00000000      8.09641133
      0.00000000      8.09641133      8.09641133
     -8.09641133      8.09641133      0.00000000
ATOMIC_POSITIONS {angstrom}
   Si      -0.02610870     -0.00524574      0.02749582
   Si      -1.36329713      1.31619849      1.42481245
   Si      -2.75218400     -0.00549830      2.71681282
...
K_POINTS crystal
30
  0.236650 0.022946 0.917156 1.0
  0.392728 0.655175 0.471114 1.0
...
epsilon.in is the same with the one used before, but with prefix = 'ZG-0.00K-si'. Now run the following to calculate \(\varepsilon_2(\omega)\) at T=0.00 K:
mpirun -n 56 $QE/pw.x -nk 28 < ZG-nscf_333_0.00K.in > ZG-nscf_333_0.00K.out
mpirun -n 28 $QE/epsilon_Gaus.x < epsilon.in > epsilon.out
The full calculation should take around 40 secs. The output files are (i) epsi_ZG-0.00K-si.dat containing \(\varepsilon_2(\omega)\), (ii) epsr_ZG-0.00K-si.dat containing the real part of the dielectric function \(\varepsilon_1(\omega)\), and (iii) eels_ZG-0.00K-si.dat containing the electron energy loss spectrum; all calculated for the equilibrium structure. In each file the first column is the energy grid, and the rest three represent the observable along the three Cartesian directions.
Take the isotropic average of the dielectric function and plot the output file in the gnuplot directory using:
awk '{print $1,($2+$3+$4)/3}' epsi_ZG-0.00K-si.dat > epsi_si_333_ZG_30_av.dat
cp epsi_si_333_ZG_30_av.dat ../../gnuplot/.
cd ../../gnuplot/; gnuplot gp_coms.p; evince ZG_spectra.eps
gnuplot gp_coms_logscale.p; evince ZG_spectra_logscale.eps
Below, we also plot \(\varepsilon_2(\omega)\) as calculated with more K-points to obtain convergence.
What are the differences between the ZG and equilibrium spectra in Figure 16 b ? Are phonon-assisted transitions captured as expected? Phys. Rev. B 94, 075125, (2016) reports the convergence of the spectra with respect to the ZG supercell size and the agreement with experimental data for the absorption coefficient.
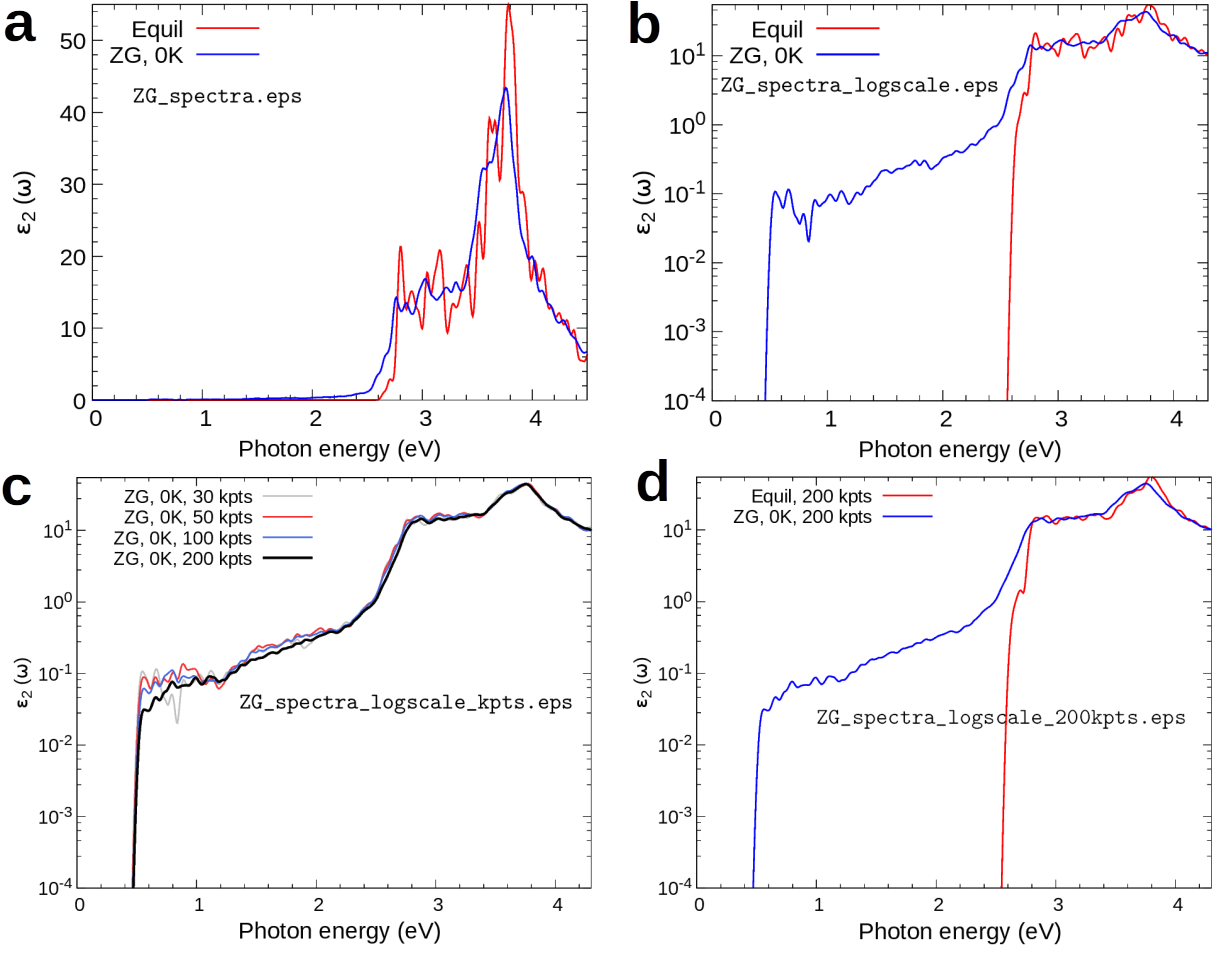
Figure 16: a Imaginary part of the dielectric function of silicon for photon energies up to 4.5 eV. Red and blue lines represent the spectra calculated with the nuclei at their equilibrium positions (direct transitions only) and at their ZG coordinates (indirect + direct transitions) for 0 K. b Same as in a but in logarithmic scale. 30 random K-points are used to sample the Brillouin zone. c Variation of the imaginary part of the dielectric function of silicon in logarithmic scale with the number of random K-points used to sample the Brillouin zone. d Same as in b but for 200 random K-points.
Exercise 5
In this exercise we will discuss the physical meaning of the ZG configuration and learn how to calculate phonon-induced diffuse (or inelastic) scattering patterns using graphene. This is an example of an observable which allows us to computationally reach the thermodynamic limit and assess multi-phonon processes. More details about the theory of phonon-induced inelastic scattering and its connection to the special displacement method can be found in Phys. Rev. Lett. 127, 207401 (2021) and Phys. Rev. B 104, 205109 (2021).
We will evaluate the exact expression for the all-phonon inelastic scattering intensity and compare it with the ZG scattering intensity, i.e. when the scatterers (nuclei) are defined by the ZG displacements. Go to the directory exercise5, create your working directories, and copy the input files:
cd ../../exercise5/; mkdir workdir; cd workdir; mkdir exact; mkdir ZG
cd exact
cp ../../inputs/exact/graphene.881.fc .
cp ../../inputs/exact/disca.in .
The file graphene.881.fc contains the IFCs of graphene calculated using an \(8\times8\times1\) q-grid.
Run a diffuse scattering calculation using disca.x and the input:
--                                                                disca.in
&input
    asr = 'crystal', amass(1) = 12.011, flfrc = 'graphene.881.fc', atm_zg(1) = 'C',
    dim1 = 40, dim2 = 40, dim3 = 1,
    T = 300,
    atmsf_a(1,1) = 0.1361,
    atmsf_a(1,2) = 0.5482,
    atmsf_a(1,3) = 1.2266,
    atmsf_a(1,4) = 0.5971,
    atmsf_a(1,5) = 0.0,
    atmsf_b(1,1) = 0.3731,
    atmsf_b(1,2) = 3.2814,
    atmsf_b(1,3) = 13.0456,
    atmsf_b(1,4) = 41.0202,
    atmsf_b(1,5) = 0.0,
    zero_one_phonon = .true., full_phonon = .true.
    nks1 = 0,  nks2 = 0,  nks3 = 0, nksf1 = 5, nksf2 = 5, nksf3 = 1,
    plane_val = 0.d0, plane_dir = 3
    qstart = 1, qfinal = 40000,
/
&pp_disca
    nrots = 6,
    kres1 = 250,
    kres2 = 250,
    kmin  = -10,
    kmax  = 10,
    col1  = 1,
    col2  = 2,
    Np    = 1600
/
and the command:
mpirun -np 56 $QE/bin/disca.x -nk 56 < disca.in > disca.out
The input format of disca.in is the same as ZG_333.in. Line 3 contains input variables similar to those in matdyn.in; in line 4 we provide the dimensions dimX of the q-grid used to sample the Brillouin zone; in line 5 we provide the temperature T in Kelvin; lines 6-15 contain the parameters of the atomic scattering factor atmsf_a and atmsf_b from Micron 30, 625–648, (1999) in line 16 we specify whether we want to compute the one-phonon (zero_one_phonon) and/or all-phonon (full_phonon) structure factor; in line 17 nksX and nksfX define the range of reciprocal lattice vectors (in crystal coordinates) and are used to determine the extent of the calculated scattering vectors Q-points); in line 18 we provide plane_val that defines the plane along which the structure factor is calculated (in units of 2pi/alat) and plane_dir defines the Cartesian direction perpendicular to the plane (where 1 –> x, 2 –> y, and 3 –> z); and in line 19 we specify the range of Q-points (from qstart to qfinal) for which the structure factor is calculated.
In the namelist &pp_disca we have: (i) nrots which is the number of rotations to be applied on the all-phonon scattering intensity to
obtain the complete map. nrots is based on the space group of each system. This step is important to avoid the extra effort of calculating the scattering intensity for wavevectors connected by rotation symmetry (see also plots at the end of the exercise). (ii) kres1 and kres2 define the resolution of the scattering intensity along the chosen Cartesian axes, (iii) col1 and col2 are integers defining two of the Cartesian directions of the scattering vectors (where 1 –> x, 2 –> y, and 3 –> z), (iv) (kmin - kmax) define the 2D momentum window in reciprocal space, and (v) Np is the number of reduced wavevectors (q-points) used to sample each Brillouin zone.
More details about all input flags are provided in this link.
The standard outputs from a disca.x run are: strf_one-ph_broad.dat and strf_all-ph_broad.dat containing the zero+one-phonon, and all-phonon scattering intensities, respectively, after convolution is applied. These files have three columns: the first two represent the Cartesian coordinates of the scattering vectors and the third column is the scattering intensity.
One can also print for each case the mode resolved and atom resolved scattering intensities by setting mode_resolved = .true. and/or atom_resolved = .true..
For printing the raw data, i.e. before convolution is applied, one can use print_raw_data = .true. to obtain the following output data: Bragg_scattering.dat, strf_one-phonon.dat, strf_q_nu_one-phonon.dat, and strf_all-phonon.dat, containing the Bragg, mode (or branch) resolved, one-phonon, and all-phonon scattering intensities, respectively. These files have four columns: the first three represent the Cartesian coordinates of the scattering vectors (Q_x, Q_y, and Q_z) and the fourth column is the scattering intensity. disca.x also prints the Q vectors in crystal coordinates in qpts_strf.dat (to be used for computing the ZG scattering intensity).
Now copy the output file strf_all-ph_broad.dat in the gnuplot directory:
cp strf_all-ph_broad.dat ../../gnuplot/exact/
Run a ZG.x calculation that allows to compute the structure factor. Go to the ZG directory and copy the input files:
::https://doi.org/10.1103/PhysRevLett.127.207401
cd ../ZG; cp ../../inputs/ZG/graphene.881.fc .; cp ../../inputs/ZG/ZG_strf.in . cp ../exact/qpts_strf.dat .
Note that we also copied qpts_strf.dat containing the Q-points generated by disca.x.
The ZG_strf.in should look like this:
--                                                                                    ZG_strf.in
&input
    asr='crystal', amass(1)= 12.011, flfrc= 'graphene.881.fc', atm_zg(1) = 'C'
    dim1 = 40, dim2 = 40, dim3 = 1,
    T = 300,
    synch = .true., compute_error = .false.
    incl_qA = .true.,
    ZG_strf = .true.
/
&strf_ZG
    qpts_strf = 40000
    atmsf_a(1,1) = 0.1361, atmsf_a(1,2) = 0.5482, atmsf_a(1,3) = 1.2266,  atmsf_a(1,4) = 0.5971,
    atmsf_a(1,5) = 0.0,
    atmsf_b(1,1) = 0.3731, atmsf_b(1,2) = 3.2814, atmsf_b(1,3) = 13.0456, atmsf_b(1,4) = 41.0202,
    atmsf_b(1,5) = 0.0,
    nrots = 6,
    kres1 = 250,
    kres2 = 250,
    kmin  = -10,
    kmax  = 10,
    col1  = 1,
    col2  = 2,
    Np    = 1600
/
Now run:
mpirun -np 56 $QE/bin/ZG.x -nk 56 < ZG_strf.in > ZG_strf.out
The input variables in the first 3 lines of ZG_strf.in are the same as in disca.in (but strictly speaking dimX, here, is for the supercell size dimensions); in line 4 we ask the code to synchronize the modes synch = .true., but not to compute the minimization function, as we have seen in Exercise 1, i.e. compute_error = .false.. We made this choice to demonstrate that the order of choosing the unique set of signs is not important as we approach the thermodynamic limit; in line 5 we make the choice to include q-points in set A by setting incl_qA = .true (at the thermodynamic limit should make no difference); in line 6 we ask the code to compute the structure factor ZG_strf = .true..
The namelist &strf_ZG is as &pp_disca seen before, but here we include the parameters of the atomic scattering factor atmsf_a and atmsf_b. We also ask the code to compute the map for 40000 Q-points qpts_strf = 40000 from file qpts_strf.dat.
More details about all input flags are provided in this link.
The calculation should take around 10 secs. The important outputs from this ZG.x run are: ZG-configuration_0.050.dat and strf_ZG_broad.dat, containing the collection of ZG atomic coordinates (as before) and the associated scattering intensity, respectively. File structure_factor_ZG_raw.dat contains the raw data and has four columns: the first three represent the Cartesian coordinates of the scattering vectors and the fourth column is the scattering intensity.
Now copy the output file strf_ZG_broad.dat in the gnuplot directory and plot your ZG and exact data:
cp strf_ZG_broad.dat ../../gnuplot/ZG
cd ../../gnuplot/ZG; gnuplot gp_pm3d.p; evince strf_ZG_40_40.eps
cd ../exact; gnuplot gp_pm3d.p; evince strf_exact_40_40.eps
Your results should look like the plots in Figure 17 (left column). We also add plots of the exact and ZG all-phonon structure maps using a \(100\times100\) and \(200\times200\) q-grid for Brillouin sampling. What happens to the ZG structure factor map as we approach the thermodynamic limit? Indeed, the choice of the order of signs is no longer important and the error in the ZG calculation is minimized at the thermodynamic limit. Our calculations also demonstrate the physical significance of the ZG configuration as the best collection of scatterers that reproduce the phonon-induced inelastic scattering.
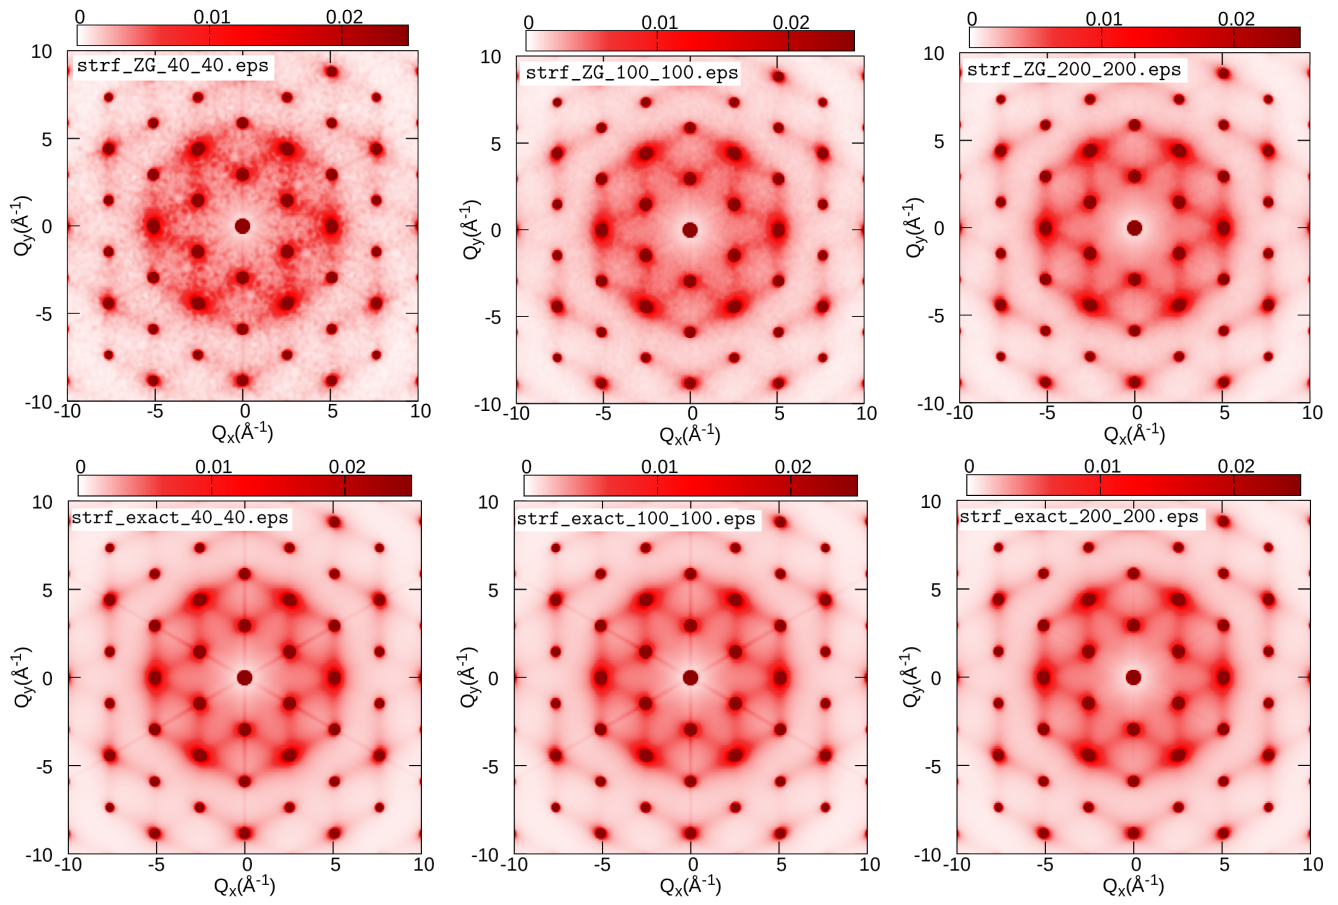
Figure 17: All-phonon diffuse scattering intensity of graphene at T = 300 K calculated using the ZG configuration (upper part) and the exact LBJ expression (lower part) for different q-grid samplings.
Exercise 6
In this exercise we will learn how to perform phonon unfolding and compute the phonon spectral function. This technique is useful to identify the effect on the phonons in the fundamental Brillouin zone when supercells are employed to accommodate disorder, defects, or any other perturbation that breaks the translational symmetry of the lattice. First, as a proof of concept, we will perform the perfect unfolding of the phonons calculated for a \(2\times2\times2\) silicon supercell; then we will show how to calculate the effect on the phonons when a \(2\times2\times2\) silicon supercell is doped by a phosphorous (P) atom.
Go to exercise6, create workdir, and calculate the phonon dispersion of silicon in the unit cell using a \(2\times2\times2\) homogeneous q-grid:
cd workdir; cp -r ../inputs/unit_cell_222_grid/ .; cd unit_cell_222_grid/
mpirun -np 4 $QE/pw.x -nk 4 < si.scf.in > si.scf.out
mpirun -np 4 $QE/ph.x -nk 4 < si.ph.in > si.ph.out
mpirun -np 1 $QE/q2r.x < q2r.in > q2r.out
mpirun -np 1 $QE/matdyn.x < matdyn.in > matdyn.out
Input files are provided here:
--                                                    si.scf.in
&control
   calculation = 'scf'
   restart_mode = 'from_scratch',
   prefix = 'si',
   pseudo_dir = './',
   outdir='./'
/
&system
   ibrav = 2,
   celldm(1) = 10.20,
   nat =  2,
   ntyp = 1,
   ecutwfc = 30.0
/
&electrons
   diagonalization='david'
   mixing_mode = 'plain'
   mixing_beta = 0.7
   conv_thr = 1.0d-7
/
ATOMIC_SPECIES
 Si  28.086  Si.pz-vbc.UPF
K_POINTS automatic
6 6 6 0 0 0
ATOMIC_POSITIONS {crystal}
 Si 0.00 0.00 0.00
 Si 0.25 0.25 0.25
/
si.ph.in:
--                                                     si.ph.in
Phonons of Silicon
&inputph
   amass(1)= 28.0855,
   prefix = 'si'
   outdir = './'
   ldisp = .true.
   fildyn = 'si.dyn'
   tr2_ph = 1.0d-12
   nq1 = 2
   nq2 = 2
   nq3 = 2
/
q2r.in
--                                                       q2r.in
&input
 fildyn='si.dyn', flfrc = 'si.222.fc'
/
matdyn.in
--                                                     matdyn.in
&input
 asr='simple', amass(1)=28.0855,
 flfrc='si.222.fc', fldyn='si.dyn.mat',
 flfrq='si.freq', fleig='si.dyn.eig', q_in_cryst_coord = .false.
 q_in_band_form = .true.
 /
  9
  0         0         0      100
  0.75      0.75      0.0    1
  0.2500    1.0000    0.2500 100
  0.000     1         0.000  100
  0         0         0      100
  0.5000    0.5000    0.5000 100
  0         1         0      100
  0.5000    1.0000    0      100
  0.5000    0.5000    0.5000 100
 /
After the calculation is completed use plotband.x of Quantum Espresso to obtain the phonon dispersion data as an a xmgr file.
$QE/plotband.x

Input file >  si.freq
Reading    6 bands at    702 k-points
Range:    0.0000  511.6990eV  Emin, Emax, [firstk, lastk] > 0 600
high-symmetry point:  0.0000 0.0000 0.0000   x coordinate   0.0000
high-symmetry point:  0.7500 0.7500 0.0000   x coordinate   1.0607
...
high-symmetry point:  0.5000 0.5000 0.5000   x coordinate   5.3534
output file (gnuplot/xmgr) > si_ph_dispersion.xmgr
bands in gnuplot/xmgr format written to file si_ph_dispersion.xmgr

output file (ps) >
stopping ...
Now calculate the interatomic force constants of silicon using a \(2\times2\times2\) supercell and the \(\Gamma\)-point for the q-grid:
cd ../; cp -r ../inputs/222_super/ .; cd 222_super
mpirun -np 56 $QE/pw.x -nk 4 < si.scf_222.in > si.scf_222.out
mpirun -np 56 $QE/ph.x -nk 4 < si.ph_222.in > si.ph_222.out
mpirun -np 1 $QE/q2r.x < q2r.in > q2r.out
Input files are provided here:
--                                             si.scf_222.in
&control
   calculation = 'scf'
   restart_mode = 'from_scratch',
   prefix = 'si',
   pseudo_dir = './',
   outdir='./'
/
&system
   ibrav = 2,
   celldm(1) = 20.40,
   nat =  16,
   ntyp = 1,
   ecutwfc = 20.0
/
&electrons
   diagonalization='david'
   mixing_mode = 'plain'
   mixing_beta = 0.7
   conv_thr = 1.0d-7
/
ATOMIC_SPECIES
 Si  28.086  Si.pz-vbc.UPF
K_POINTS automatic
3 3 3 0 0 0
ATOMIC_POSITIONS (crystal)
Si   0.00000000   0.00000000   0.00000000
Si  -0.12500000   0.37500000  -0.12500000
Si   0.50000000   0.00000000   0.00000000
Si   0.37500000   0.37500000  -0.12500000
Si   0.00000000   0.50000000   0.00000000
Si  -0.12500000   0.87500000  -0.12500000
Si   0.50000000   0.50000000   0.00000000
Si   0.37500000   0.87500000  -0.12500000
Si   0.00000000   0.00000000   0.50000000
Si  -0.12500000   0.37500000   0.37500000
Si   0.50000000   0.00000000   0.50000000
Si   0.37500000   0.37500000   0.37500000
Si   0.00000000   0.50000000   0.50000000
Si  -0.12500000   0.87500000   0.37500000
Si   0.50000000   0.50000000   0.50000000
Si   0.37500000   0.87500000   0.37500000
si.ph.in:
--                                                si.ph.in
Phonons of Silicon
&inputph
   amass(1)= 28.0855,
   prefix = 'si'
   outdir = './'
   ldisp = .true.
   fildyn = 'si.dyn'
   tr2_ph = 1.0d-12
   nq1 = 1
   nq2 = 1
   nq3 = 1
/
q2r.in:
--                                                  q2r.in
&input
  fildyn='si.dyn', flfrc = 'si.222.fc'
/
Now perform phonon unfolding of the phonons of silicon calculated for a \(2\times2\times2\) supercell using ZG.x:
mpirun -np 56 $QE/ZG.x -nk 56 < ZG_ph_unfold.in > ZG_ph_unfold.out
where the input file is:
--                                                             ZG_ph_unfold.in
&input
    flfrc='si.222.fc',
    asr='simple', amass(1)=28.0855
    q_in_cryst_coord = .false., q_in_band_form = .true.
    ZG_conf = .false., ph_unfold = .true.
/
&phonon_unfold
     dim1 = 2, dim2 = 2, dim3 = 2
     ng1 = 14, ng2 = 14, ng3 = 14
     flfrq='frequencies.dat', flweights='unfold_weights.dat'
/
 9
   0.000000   0.000000   0.000000  74
   1.500000   1.500000   0.000000   1
   0.500000   2.000000   0.500000  24
   0.000000   2.000000   0.000000  70
   0.000000   0.000000   0.000000  60
   1.000000   1.000000   1.000000  60
   0.000000   2.000000   0.000000  34
   1.000000   2.000000   0.000000  50
   1.000000   1.000000   1.000000   1
/
Here, lines 3-5 contain standard inputs for a phonon dispersion calculation (as for matdyn.x). In line 4, we specify that we would like to use ZG.x for phonon unfolding (ph_unfold = .true.) and not to generate special displacements (ZG_conf = .false.). In the namelist &phonon_unfold we have: (i) dimX which are essentially the supercell dimensions, (ii) ngX which define the range of the reciprocal lattice vectors (and thus plane waves) that need to be employed for calculating the spectral weights. Check for convergence by increasing this number; already 14 is a tight value, (iii) flfrq is the name of the output file containing the frequencies for each band and Q-point and (iv) flweights is the name of the output file containing the spectral weights for each band and Q-point. At the end of the file we provide the high-symmetry path for which we would like to perform phonon unfolding. The input structure of path is in the same spirit with a matdyn.x calculation. As for the electron band structure unfolding, the coordinates of the Q-points are obtained by multiplying the q wavevectors (defining the fundamental Brillouin zone) with the dimensions of the supercell, i.e. if q \(= [ x \,\,\, y \,\,\, z]\) then Q \(= [ {\rm dim1} \times x \,\, {\rm dim2} \times y \,\, {\rm dim3} \times z]\).
Now we have the phonon frequencies and their spectral weights, we can calculate the phonon spectral function using pp_spctrlfn.x. Convert first the raw data in frequencies.dat and unfold_weights.dat into a different format using plotband.x of QE (commands provided in bands.sh):
$QE/plotband.x unfold_weights.dat < spectral_weights.in > spectral_weights.out
$QE/plotband.x frequencies.dat < energies.in > energies.out
sed -i '/^\s*$/d' spectral_weights.dat # remove empty lines
sed -i '/^\s*$/d' energies.dat
paste energies.dat spectral_weights.dat > tmp
awk '{print $1,$2,$4}' tmp > energies_weights.dat; rm tmp
You have just generated energies_weights.dat file in a similar format to a “.gnu” file where the first column has the momentum-axis values, the second the phonon frequencies, and the third the spectral weights. Now proceed with the calculation of the spectral function:
ibrun -n 28 $QE/pp_spctrlfn.x -nk 28 < pp_spctrlfn.in > pp_spctrlfn.out
cp spectral_function.dat ../../gnuplot/spectral_function_222.dat
cd ../../gnuplot/; gnuplot gp_pm3d_222.p; evince ph_unfolding_perfect_222.eps
where the input file should look like:
--                                                                      pp_spctrlfn.in
&input
  flin = 'energies_weights.dat'
  steps = 17952,
  ksteps = 300,
  esteps = 300,
  kmin = 0,
  kmax = 5.3534,
  emin =  -10
  emax = 550
  flspfn = 'spectral_function.dat'
/
Note
The description of the input flags is available in Exercise 2.
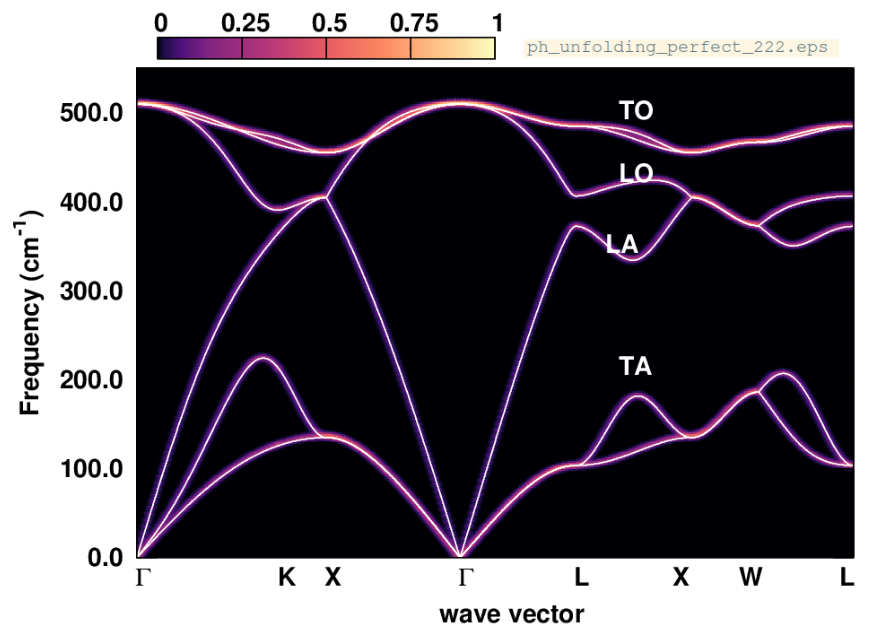
Figure 18: Phonon spectral function of silicon obtained by unfolding the phonons calculated with the atoms clamped at their high-symmetry position in a \(2\times2\times2\) supercell.
Figure 18 shows the silicon phonon spectral function (color map) which overlays with the phonon dispersion calculated in the unit cell (white lines), since the supercell is an exact periodic replica of the unit cell. One can also check the raw data in unfold_weights.dat, and observe that the weights of the phonon frequencies are either 1 or 0, making an one-to-one correspondence with the frequencies calculated in the unit cell.
Now go to workdir, calculate the phonons of P-doped silicon, and perform phonon unfolding:
cd ../workdir/;cp -r ../inputs/222_super_P_doped .; cd 222_super_P_doped/
mpirun -np 56 $QE/pw.x -nk 4 < si.scf_222.in > si.scf_222.out
mpirun -np 56 $QE/ph.x -nk 4 < si.ph_222.in > si.ph_222.out
mpirun -np 1 $QE/q2r.x < q2r.in > q2r.out
mpirun -np 56 $QE/ZG.x -nk 56 < ZG_ph_unfold.in > ZG_ph_unfold.out
Note
Here we replace one Si atom with a P atom and provide the relaxed structure. Due to the excess electron the system becomes metalic.
The input files are provided:
--                                                          si.scf_222.in
&control
   calculation = 'scf'
   restart_mode = 'from_scratch',
   prefix = 'si',
   pseudo_dir = './',
   outdir='./'
/
&system
   ibrav = 2,
   celldm(1) = 20.40,
   nat =  16,
   ntyp = 2,
   ecutwfc = 30.0
   occupations='smearing'
   degauss = 0.01
   nosym =.true.
/
&electrons
   diagonalization='david'
   mixing_mode = 'plain'
   mixing_beta = 0.7
   conv_thr = 1.0d-7
/
ATOMIC_SPECIES
 Si  28.086  Si.pz-vbc.UPF
 P  30.974   P.pz-hgh.UPF
K_POINTS automatic
3 3 3 0 0 0
ATOMIC_POSITIONS (crystal)
P             0.0000000002       -0.0000000243        0.0000000412
Si           -0.1261235427        0.3783706126       -0.1261235364
Si            0.4983582216        0.0016417759        0.0016417825
Si            0.3751699490        0.3751699540       -0.1255098692
Si            0.0016417706        0.4983582252        0.0016417800
Si           -0.1261235463        0.8738764598       -0.1261235454
Si            0.4983582134        0.4983582133        0.0016417907
Si            0.3783706477        0.8738764517       -0.1261235465
Si            0.0016417985        0.0016418052        0.4983581945
Si           -0.1255098925        0.3751699883        0.3751699378
Si            0.4983582056        0.0016417944        0.4983582063
Si            0.3751699659        0.3751699770        0.3751699562
Si            0.0016417902        0.4983582115        0.4983582106
Si           -0.1261235587        0.8738764426        0.3783706794
Si            0.4999999969        0.5000000190        0.4999999746
Si            0.3751699807        0.8744900937        0.3751699437
si.ph_222.in:
--                                                     si.ph_222.in
&inputph
   amass(1)= 28.0855,
   amass(2)= 30.974,
   prefix = 'si'
   outdir = './'
   ldisp = .true.
   fildyn = 'si.dyn'
   tr2_ph = 1.0d-12
   epsil = .false.
   nq1 = 1
   nq2 = 1
   nq3 = 1
/
q2r.in:
--                                                         q2r.in
&input
 fildyn='si.dyn', flfrc = 'si.222.fc'
/
ZG_ph_unfold.in:
--                                                                    ZG_ph_unfold.in
&input
    flfrc='si.222.fc',
    asr='simple', amass(1)=28.0855, amass(2)= 30.974
    q_in_cryst_coord = .false., q_in_band_form = .true.
    ZG_conf = .false.
    ph_unfold = .true.
/
&phonon_unfold
     dim1 = 2, dim2 = 2, dim3 = 2
     ng1 = 14, ng2 = 14, ng3 = 14
     flfrq='frequencies.dat', flweights='unfold_weights.dat'
/
 9
   0.000000   0.000000   0.000000  74
   1.500000   1.500000   0.000000   1
   0.500000   2.000000   0.500000  24
   0.000000   2.000000   0.000000  70
   0.000000   0.000000   0.000000  60
   1.000000   1.000000   1.000000  60
   0.000000   2.000000   0.000000  34
   1.000000   2.000000   0.000000  50
   1.000000   1.000000   1.000000   1
Now we have the phonon frequencies and their spectral weights, we can calculate the phonon spectral function using pp_spctrlfn.x as before. Convert first the raw data in frequencies.dat and unfold_weights.dat into a different format using plotband.x of QE (commands provided in bands.sh):
$QE/plotband.x unfold_weights.dat < spectral_weights.in > spectral_weights.out
$QE/plotband.x frequencies.dat < energies.in > energies.out
sed -i '/^\s*$/d' spectral_weights.dat # remove empty lines
sed -i '/^\s*$/d' energies.dat
paste energies.dat spectral_weights.dat > tmp
awk '{print $1,$2,$4}' tmp > energies_weights.dat; rm tmp
Proceed with the calculation and plot of the spectral function:
ibrun -n 28 $QE/pp_spctrlfn.x -nk 28 < pp_spctrlfn.in > pp_spctrlfn.out
cp spectral_function.dat ../../gnuplot/spectral_function_222_P_doped.dat
cd ../../gnuplot/; gnuplot gp_pm3d_222_P_doped.p; evince ph_unfolding_P_doped_222.eps
where the input file pp_spctrlfn.in is the same as before:
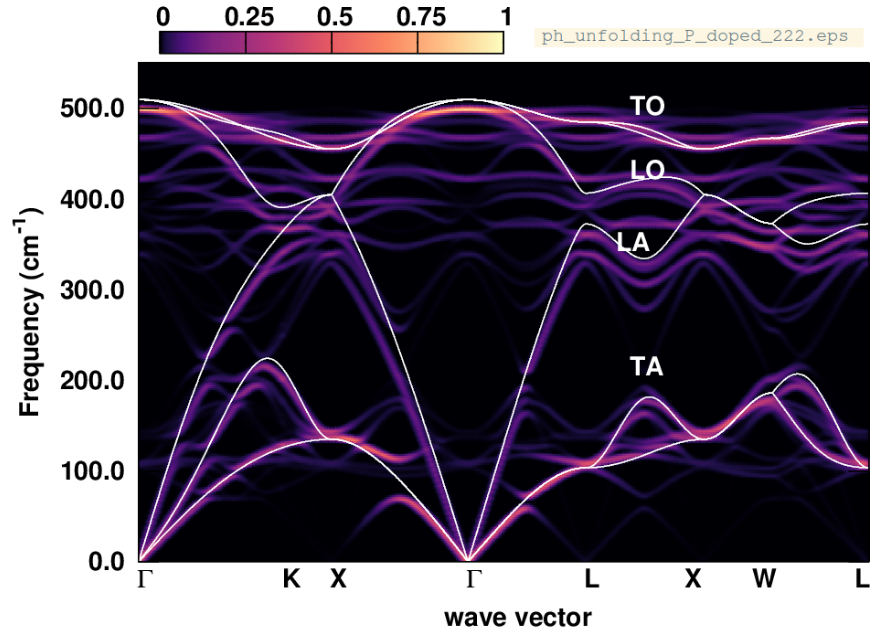
Figure 19: Phonon spectral function of P-doped silicon calculated in a \(2\times2\times2\) supercell.
What are the changes in the phonon dispersion? Below we also provide the phonon spectral function calculated after replacing one Si atom with a P atom in a \(3\times3\times3\) supercell. Why are the changes less pronounced now?
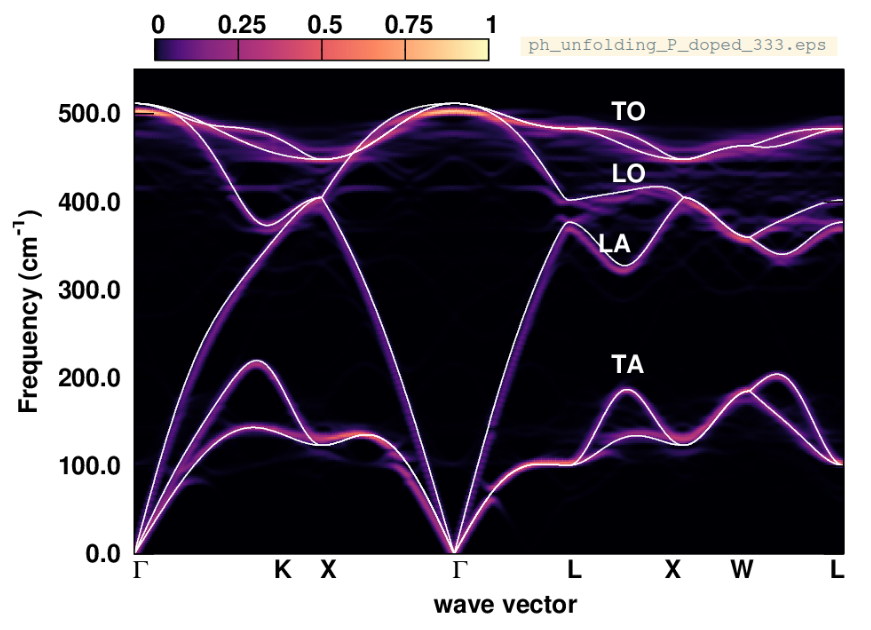
Figure 20: Phonon spectral function of P-doped silicon calculated in a \(3\times3\times3\) supercell.